The Impact of Artificial Intelligence on the Brazilian Economy
What will be the actual impact of artificial intelligence (AI) on Brazil’s economic growth in the coming years? To answer this question, Reglab conducted a comprehensive, quantitative study focusing on the period from 2027 to 2030.
The results point to a structural transformation: AI has the potential to add BRL 986.7 billion (approx. USD 190.6 billion at the exchange rate of August 12, 2026) to Brazil’s Gross Domestic Product (GDP) in 2030. This represents approximately 7.6% of the country’s estimated GDP for 2026, the baseline year of the projection.
The research indicates that this growth will not stem from an abrupt disruption, but rather from gradual, cumulative gains: we will produce more with the same resources, with fewer errors and better decisions — machine by machine, worker by worker.
What you will discover in this study:
the drivers of growth: understand how the impact is divided between the Labor Channel (65% of the gains, tied to the cognitive productivity of professionals) and the Capital Channel (35% of the gains, tied to the efficiency of machines and processes);
detailed sectoral analysis: data on productivity gains across 12 sectors of the Brazilian economy;
innovation in agribusiness: discover why 92% of the BRL 48.2 billion gain in agriculture will come through the Capital Channel — driven by drones, sensors and smart harvesters.
Download the complete study and see how artificial intelligence could shape the future of your sector.
COSTA FILHO, J. R; PALANCA, T. Impacto da IA na economia brasileira. Policy Briefs Reglab, n. 7 São Paulo: Reglab, 2025.
Costa Filho, J. R., & Palanca, T. (2025). Impacto da IA na economia brasileira. Policy Briefs Reglab, (7). Reglab.
Costa Filho, J. R., e T. Palanca. "Impacto da IA na economia brasileira." Policy Briefs Reglab, n. 7 (2025). São Paulo: Reglab.
Autores
João Costa Filho
Thais Palanca
Tags
Applied Economics Center, Artificial Intelligence (AI), Policy Brief
POLICY BRIEFS
The impact of Artificial Intelligence on the Brazilian Economy
About Reglab
We are a private research center specializing in the media and technology sector. We help companies, associations, and policymakers make strategic, data- and evidence-based decisions.
The Policy Briefs Series encompasses studies that evaluate trends, existing public policies, or legislative proposals, using qualitative and quantitative data to inform and guide decisions. The goal is to present complex topics in an accessible way, highlighting the main points of analysis, impacts, and possible recommendations.
Acknowledgements
Executive Director: Pedro Henrique Ramos
Research Director: Marina Gonçalves Garrote
Digital Economy Hub Coordinator: João Ricardo Costa Filho
Authors: João Ricardo Costa Filho and Thais Palanca
Researchers: João Ricardo Costa Filho and Thais Palanca
Final Layout: Larissa Camargo
Suggested citation: COSTA FILHO, J. R; PALANCA, T. Impact of AI on the Brazilian economy. Policy Briefs Reglab, n. 7 São Paulo: Reglab, 2025.
This is one of the first studies to estimate, in the medium term, the potential impact of Artificial Intelligence on Brazil’s Gross Domestic Product (GDP). AI could add up to R$986.7 billion to Brazil’s GDP by 2030. This study estimates that impact across different sectors in the Brazilian economy.
The sector with the greatest total impact is manufacturing industries (R$264.2 bn), followed by other service activities (R$165.4 bn) and commerce (R$131.2 bn).
AI operates through two channels: making workers more productive accounting for 65% of the impact) and making machinery and equipment more efficient (accounting for 35% of the impact).
In agriculture, AI arrives mainly through the capital channel (92% of the impact), via smart machinery. The present value of the impact on the sector is R$48.2 billion.
Because productivity gains occur gradually, as firms take up new tools, the effects on GDP also materialise gradually: by 2030, up to 66.6% of the gains from more productive workers and up to 62.4% of the increments from more productive machinery, equipment and structures are projected to have been realised.
1. Introduction
1.1 Artificial Intelligence and economic growth in Brazil
What will be the impact of artificial intelligence (AI) on Brazilian economic growth over the next four years? Getting that answer is crucial for mapping scenarios and properly designing public policies in a country that has recorded decades of low aggregate productivity growth. Even though the importance of this question is directly related to the difficulty of answering it, this study brings a macro-sectoral perspective to the debate. Different sectors of the economy have distinct exposures and mechanisms when it comes to capturing the production gains arising from the adoption of AI tools.
Imagine a soybean farm in Mato Grosso. Drones fly over thousands of hectares of cropland, collecting real-time images. Soil sensors monitor moisture and nutrients. AI-equipped harvesters automatically adjust their operation according to variation in the crop. This is not a futuristic scenario: it is already an increasingly real part of Brazilian precision agriculture.
But the transformation is not limited to the countryside. Lawyers use AI to review contracts in minutes. Doctors receive assistance from medical imaging diagnostic algorithms. Financial analysts automate reports that used to take days. AI is changing the way we work in virtually every sector of the economy. Against this backdrop, how much does this advance actually represent in terms of growth for national Growth Domestic Product (GDP)?
This study covers the period from 2027 to 2030. Through intrasectoral relationships — that is, the commercial transactions that sectors carry out among themselves — and with an extension of the methodology proposed by Acemoglu (2025), adapted to the specificities of the Brazilian economy, we estimate the impacts on sectoral output and on Brazil’s GDP.
1.2 How does AI increase countries’ GDP?
GDP is the sum of everything a country produces in final goods and services over a given period. When we say that AI can increase GDP, we mean that these tools can help the country produce more with the resources it already has. This does not happen only when new companies emerge or when more people enter the labor market. It also happens when activities that already exist are carried out more quickly, with fewer errors, less waste, and better decisions.
A company that delivers more in the same amount of time, a professional who completes a task in minutes instead of hours, or a machine that stops less often during production: all of this, taken together, increases the economy’s output. The impact of AI comes precisely from this sum of many small gains spread across different sectors. And that impact comes through two different effects: one on workers and another on capital.
1.2.1 The worker effect: more productive workers
The first channel through which AI impacts GDP is labor. Cognitive AI (language assistants, data analysis tools, text and code generators) raises the productivity of segments of the workforce. In these cases, professionals’ functions are complemented by AI, which takes on cognitive tasks, freeing the worker for higher value-added activities.
In agriculture, for example, this channel is illustrative precisely because of its limitations: an agricultural technician who previously spent hours manually analyzing satellite images to identify pests or estimate productivity now uses AI systems to obtain the same result in minutes. AI expands their analytical capacity without replacing them.
However, there is an important detail for agriculture: the vast majority of rural workers carry out manual activities with low cognitive exposure to AI. Tasks such as harvesting, planting, and animal husbandry present automation restrictions for this technology. For this reason, the labor channel contributes only 8% of the impact in this sector (well below the national average of 65%).
In manufacturing industries — the sector with the highest estimated impact, at R$264.2 billion in present value — the profile of the labor channel is quite different. Quality technicians, assembly line operators, and process engineers use AI tools for automated visual inspection, predictive machine maintenance, and optimization of manufacturing parameters. Although the sector’s cognitive exposure is moderate (close to 33%), labor’s share in the production structure is high (around 58%). This combination means that the worker effect accounts for roughly 60% of the estimated sectoral impact.
In financial activities (banks, insurance companies, and investment managers), cognitive AI is the main driver of transformation. Credit analysts use language models to review documentation and assess risk in a fraction of the conventional time; insurance operators classify claims with the help of computer vision; virtual assistants serve millions of customers with increasing quality. The financial sector’s cognitive exposure is the highest in the Brazilian economy,, which means that 87% of this sector’s impact comes from the effect on workers (the highest percentage among the twelve sectors analyzed).
1.2.2 The capital effect: more efficient machines
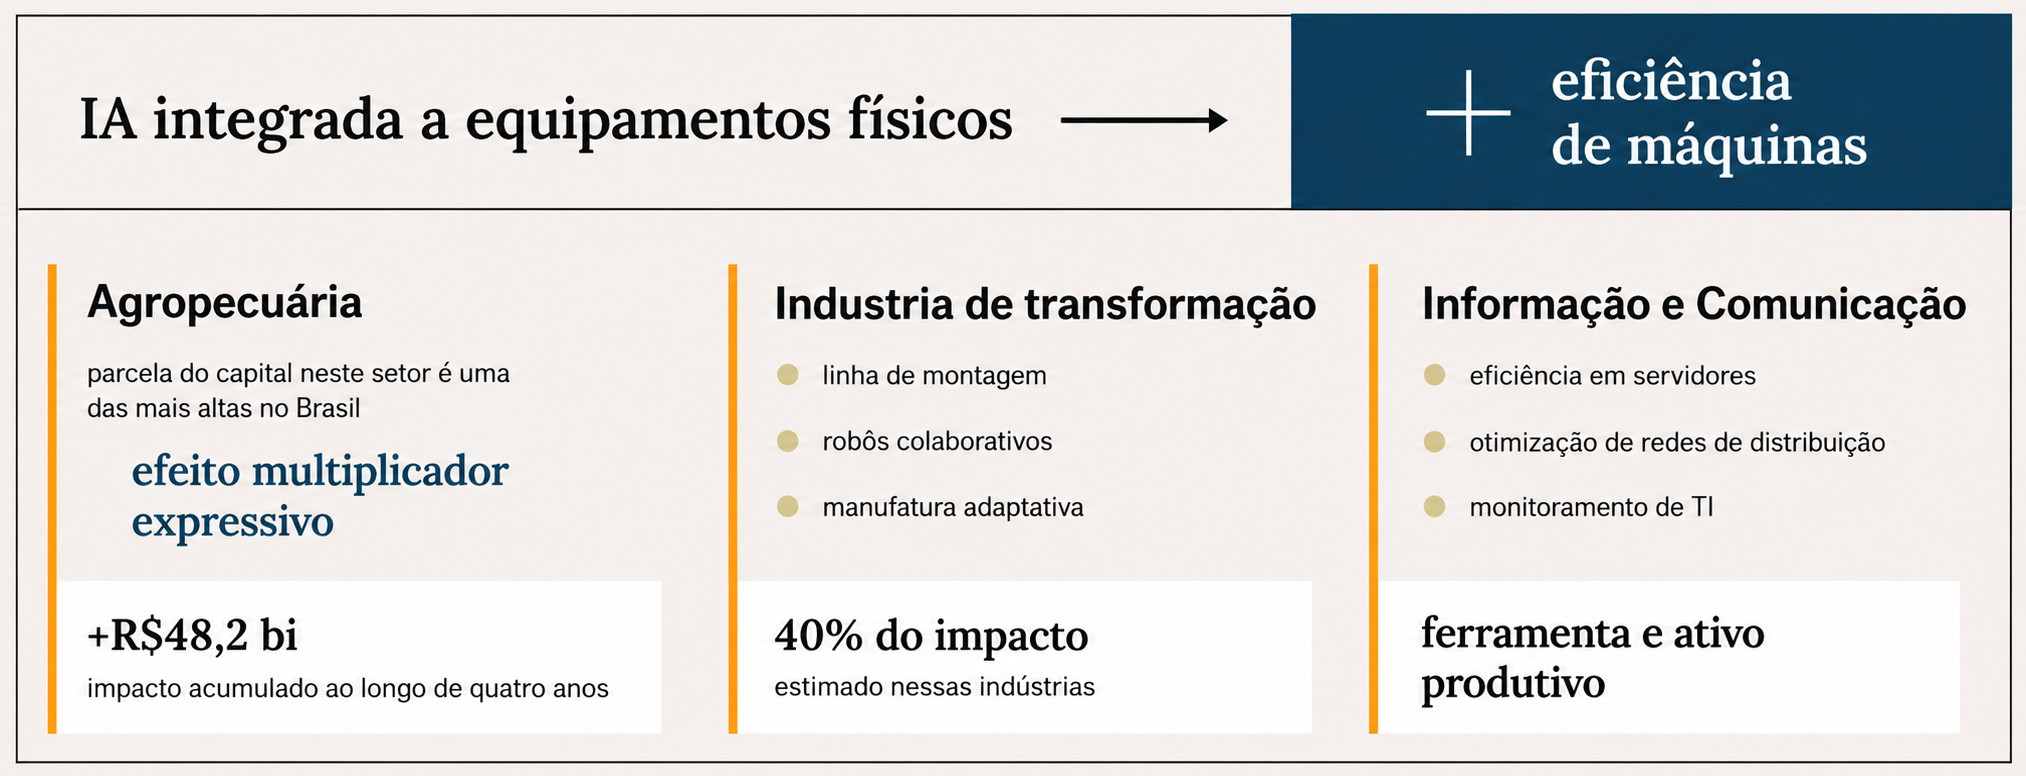
The second channel is machine efficiency. AI integrated into physical equipment (robotics, smart sensors, automated manufacturing, autonomous vehicles) makes each unit of capital more productive.
In agriculture, for example, this channel is dominant, since the capital share in the sector is one of the highest in Brazil. This means that each efficiency gain in machinery has a significant multiplier effect on the sector’s output. This is why, even with low cognitive exposure, agriculture could have an accumulated impact, over four years, of R$48.2 billion (in present value).
In manufacturing industries, AI integrated into capital appears in assembly lines with computer vision for quality control, collaborative robots (cobots) that operate alongside humans, and adaptive manufacturing systems. A steel plant, for example, uses AI to adjust the steel composition in real time based on temperature and chemical composition sensor data, reducing scrap, raising the quality of the final product, and decreasing energy consumption. The capital channel accounts for 40% of the estimated impact on manufacturing industries.
In the information and communication sector (software developers, data centers, telecommunications operators), AI applied to capital manifests itself in more efficient inference servers, content distribution networks optimized by algorithms, and automatic IT infrastructure monitoring systems. The boundary between physical and intellectual capital is especially thin here: AI models are, at the same time, a work tool and a productive capital asset.
2. Methodology
To calculate the impact of AI on the economy, we need to consider that the total impact is, in each sector, the result of the sum of effects through the labor and the capital. Each of these channels, however, is made up of four pillars in order for its effects to be estimated.
The total impact:
Total impact: sum of effects through the worker and the capital effects
Elements of the worker effect
The impact of AI on workers combines four elements: labor’s share in the sector’s value added, cognitive exposure to AI, the fraction of exposed tasks that is economically substitutable, and the productivity gain per task.
The first element, labor’s share in each sector’s value added, measures how much of sectoral output goes toward workers’ compensation (wages and payroll charges), and indicates whether the sector’s production technology is more labor- or capital-intensive. Sectors with a high share amplify the labor channel more. The variation across sectors is large: in agriculture, only 19% of value added is labor; in commerce, 51%; in financial activities, 39% (Resources and Uses Table, IBGE 2019).
The second element is cognitive exposure to AI, which measures how much the occupations in each sector perform tasks amenable to support or automation by these technologies. Here we consider the use of AI for text analysis, code generation, information synthesis, customer service, and others. Sectoral exposure was constructed using AIOE occupational scores (Artificial Intelligence Occupational Exposure, from Felten, Raj, and Seamans, 2021, 2023). These values were applied to the Brazilian occupations present in the PNADc 2023 (Continuous National Household Sample Survey, IBGE), with aggregation by CNAE sections (National Classification of Economic Activities). This means that, through the national sample provided by the PNADc, we were able to establish the size of each occupation within each sector of productive activity in Brazil. Once the exposure score was applied, we were able to measure Brazilian sectoral exposure on the basis of the weight of each occupation per sector. For example, the highest exposure in the Brazilian economy is in financial activities and the lowest in agriculture.
The third element is the fraction of exposed tasks that is economically substitutable. Here it is important to distinguish two concepts that can be easily conflated: exposure, which measures how much a task can involve AI in the process; and substitutability, which measures whether it is in fact worthwhile, technically and economically, to let AI perform it alone. A task can be highly exposed and still remain more efficient in the hands of a person. This is because many tasks require judgment that is better exercised by human beings, or because AI automation on its own is insufficient to carry them out; some functions therefore remain more efficient when performed by humans, who in turn are assisted by the technology.
Following Acemoglu (2025), we calibrate this question in the central scenario, assuming that of every 100 cognitively exposed tasks, 23 pass the cost-benefit test for full automation within the next decade, while the other 77 enter the calculation as a complement to human productivity. This means that, in practice, occupations rarely disappear entirely: what AI reorganizes is the set of tasks within each function. A portion is indeed absorbed by automation, but most of the work continues to be performed by people, who now become faster and more precise with AI support. For this reason, in the central scenario, the predominant effect on labor is complementarity, not substitution. It is worth stressing that this parameter is not a measure of adoption over time (which we address separately in the diffusion curve discussed below), but rather the structural ceiling of what can be substituted with the available technology. The decomposition between complementable and substitutable tasks in each sector (Cazzaniga et al., 2024) is incorporated into the following element.
Finally, the productivity gain per task measures how much more efficient a worker becomes when performing with AI support a task supported by the technology. Experimental evidence shows performance increases of 20% to 40% on cognitive tasks of moderate complexity (Noy and Zhang, 2023; Brynjolfsson, Li, and Raymond, 2025). We adopt the parameter of 27% as the central point, an intermediate level within this range and consistent with Acemoglu (2025), adjusted for the composition of each sector. This adjustment is necessary because the gain per task depends on how AI acts upon it. When AI substitutes for the task (performing it in full), the gain is larger, since it entirely frees up the time the work previously spent on that activity – something more frequent in the information and communication and finance sectors. When AI merely complements the worker (taking on part of the task but still requiring their involvement), the gain is smaller, since the technology plays an auxiliary role — a pattern more common in education and real estate activities.
Pillars of the worker effect
Elements of the capital effect
The impact through the capital channel has a similar and parallel structure to the one described above for workers: capital’s share in the sector’s value added, the capital’s exposure to AI technologies, the fraction of economically substitutable or complementary capital, and the efficiency gain per unit of capital.
Capital’s share in value added is the complement of labor’s share and captures the portion of value added that remunerates capital (profits, interest, rents, depreciation). Sectors with a high capital share amplify the capital effect more than labor-intensive sectors do. The variation across sectors is large: in agriculture, 81% of value added is capital; in manufacturing industries, 42%; and in financial activities, 61% (RUT, IBGE 2019), for example.
Capital’s exposure to AI measures the degree to which the machinery, equipment, and productive infrastructure in each sector can be improved or replaced by AI-incorporating capital. We constructed this exposure using Webb (2020) scores, derived from 16 million USPTO (United States Patent and Trademark Office) classified by robotics, computer vision, natural language processing, and machine learning capabilities, and associated with the types of capital characteristic of each sector. Among the twelve activities analyzed, the highest values are in the construction and agriculture sectors, and the lowest belongs to public administration.
The fraction of economically substitutable or complementary capital acts analogously to that of the worker effect. This channel exists because not every piece of equipment or software will be affected, even within what the technology could in principle reach. We calibrate a structural ceiling of 15% in the central scenario (more conservative than that for labor), reflecting the greater investment friction in physical capital (Babina et al., 2024; Brynjolfsson, Rock, and Syverson, 2019). In other words, this value reflects the fact that firms do not replace their stock of machines overnight. Renewing equipment requires high investment, integration with existing systems, and time to amortize current capital. As with the labor element, this parameter is not a measure of adoption over time, but a structural ceiling of what can be improved or replaced with the available technology.
Finally, we have capital efficiency gain, which measures how much more productive a unit of capital becomes with the incorporation of AI. In practice, an AI-supported machine breaks down less often thanks to predictive maintenance, produces with greater consistency, consumes less energy and fewer inputs, and generates less scrap in manufacturing. We adopt the parameter of 18%, based on Acemoglu (2025) and on the literature on technological diffusion in productive capital.
Pillars of the Capital effect
These calculations show the potential impact of AI, but this potential does not appear all at once. The technology needs to be adopted by firms, workers, and governments, and this process tends to be gradual: first few use it, then adoption accelerates and, over time, it stabilizes.
In Brazil, we consider that this advance tends to be slower than in advanced economies, because there are large differences between companies, high credit costs, professional qualification gaps, and infrastructure limitations. Therefore, the estimated results for 2027–2030 represent only a part of AI’s total potential — and could be greater if adoption occurred more rapidly.
The four elements above, both for workers and for capital, define the long-term impact — that is, the effect that would materialize if the technology were fully diffused across the sector’s productive base and workforce. To distribute this impact over time, we apply an S-curve (Gompertz) with distinct parameters for each channel. This means that adoption is initially small (the bottom of the “S”), followed by an acceleration of adoption and, finally, a deceleration.
For the worker effect, we consider a higher speed with inflection in 2027, while we assume that the capital effect is slightly slower and has its inflection approximately two years later, reflecting the greater delay associated with the substitution and updating of physical equipment. This calibration is slower than that observed in advanced economies by Cazzaniga et al. (2024b), reflecting structural constraints on technology diffusion in Brazil given the heterogeneity among firms, the cost of credit, and human capital bottlenecks. Therefore, the GDP impact could be even greater with faster diffusion.
3. Results
3.1. The aggregate impact
In the central scenario, the adoption of artificial intelligence in the Brazilian economy could generate an accumulated impact of 2.77% of GDP over four years (2027–2030). In present value, discounted at the Selic rate of 13% per year and based on the estimated 2026 GDP of R$12.9 trillion, this is equivalent to an additional R$986.7 billion, which would be roughly 7.6% of 2026 GDP. The average rate of economic expansion resulting from the introduction of AI is estimated at 0.69 percentage points per year over the period considered.
The effects of AI on workers accounts for 65% of the total (1.79 p.p. over four years): AI expands the productivity of workers in sectors with high cognitive density, such as financial services, commerce, and public administration. The effects on capital accounts for the remaining 35% (0.98 p.p.): AI embedded in machines, systems, and productive processes raises the efficiency of the capital stock, with particularly significant weight in sectors intensive in physical assets, such as agriculture and extractive industries.
Heterogeneity, whose results are addressed in the next section, is the main empirical argument in favor of a model that explicitly considers both channels, rather than aggregating everything into a single “AI exposure” index.
3.2. The sectoral impact
The estimated R$986.7 billion does not distribute evenly across the economy’s sectors. Brazil’s productive structure has sectors that are very distinct in terms of how much production depends on labor and capital, as well as in the degree of cognitive exposure of each task — elements that determine where the impact is greatest in absolute terms and through which channel it arrives. In this section we present the results for the 12 different activity sectors of the Brazilian economy in the IBGE National Accounts System.
Manufacturing industries lead the ranking with an impact of R$264.2 billion over the period. This result reflects their weight in the productive structure and a balanced exposure between labor and capital. Next comes the group of other service activities, with an estimated impact of R$165.4 bn, and commerce, with R$131.2 bn. Both benefit from the high intensity of cognitive labor. At the other extreme, smaller sectors, such as real estate activities and transportation, show lower absolute impacts, though still relevant in relative terms.
Economic Impact of AI on Sectoral Output (R$ billions; 2027–2030)
Although there are sectors with similar impacts, such as information and communication (R$49.3 bn) and agriculture (R$48.2 bn), the proportions between the effect on workers and the effect on capital can be very different. In the former segment, 97% of the estimated gain stems from the effects of artificial intelligence through the labor factor. By contrast, in the agricultural sector, 92% of the total impact is captured via the capital.. The chart bellow presents this structural decomposition for each of the activities analyzed.
Decomposition of Impact by Transmission Channel (% of sectoral impact; 2027–2030)
We can observe that sectors with a high concentration of cognitive workers, such as public administration, information and communication, and financial activities, have up to 99% of their impact via labor. Sectors intensive in physical capital, such as agriculture, construction, and real estate activities, have more than 90% of their impact via capital. Manufacturing occupies an intermediate position (61% via the labor and 39% via capital), reflecting its hybrid profile between cognitive tasks and intensive use of machinery.
4. Discussion and analysis
This section analyzes the study’s data through the lens of the authors of this work.
Beyond the projection of a positive impact on Brazil’s GDP in the 2027–2030 period, the modeling approach adopted — which incorporates intrasectoral relationships and analytically decomposes the transmission channels on output — offers a fundamental input for the formulation of public policies.
This methodological approach makes it possible to identify strategies that maximize the effects of AI in an inclusive, cross-cutting, and comprehensive manner. Furthermore, the detailed mapping of channels through which productivity growth manifests itself in output growth assists in creating mitigation mechanisms for agents negatively affected by the technological transition, which may enable faster reallocation and could allow them also to share in the aggregate gains generated by economic efficiency:
Professional retraining for high-substitution groups. The degree of exposure of cognitive activities (such as financial services, IT, and administrative support) to AI technologies makes it necessary to design institutional retraining policies (upskilling and reskilling). The literature (Acemoglu, 2025; ILO, 2025a; OECD, 2025a) indicates that the effectiveness of occupational transition is conditioned on the workforce’s capacity to adapt to new, more complex operational routines.
Digital infrastructure in rural areas. Realizing the capital effects projected for agriculture, associated with estimates of up to R$48.2 billion in net present value, depends on the expansion of rural connectivity and data processing infrastructure (FAO, 2023; World Bank, 2021a; Zeng et al., 2024).
Incentives for AI adoption in low-productivity sectors. Commerce and service activities, whose potential impacts are estimated at R$131.2 billion and R$165.4 billion respectively, display technical heterogeneity in absorbing AI. The literature (Acemoglu & Johnson, 2023; OECD, 2025b) suggests that technical assistance and operational support programs for micro and small enterprises are conditioning factors for reducing adoption barriers in these segments.
A clear and predictable regulatory framework. The formulation of the normative framework for artificial intelligence in Brazil seeks to balance the legal certainty required for productive investment with the safeguarding of fundamental rights and the mitigation of systemic risks (Cerutti et al., 2025; SIDI, 2025). Predictability of the rules operates as a structuring element for the consolidation of economic projection scenarios.
Data governance and open data. Data are the primary input of AI systems, which is why the availability and quality of data are central to the development of the ecosystem. The Brazilian context has representative structural databases (such as the Pix ecosystem, SUS health data, and agricultural remote sensing databases). However, interoperability bottlenecks, institutional fragmentation, and regulatory uncertainty regarding the secondary use of administrative data limit their technical exploitation. Governance and open data policies are discussed in the literature (Covington & Burling, 2024; UNESCO, 2024; World Bank, 2024) as instruments for reducing barriers to market entry, provided that privacy, personal data protection, and intellectual property parameters are safeguarded.
AI in public services. The Brazilian Artificial Intelligence Plan (PBIA 2024–2028), with a projected allocation of R$23 billion in health, education, and public management, positions the State as a driver of technological demand. The public policy literature (OECD, 2025c; UNCTAD, 2024; World Bank, 2021b) stresses that the public sector’s role as a first-mover buyer can foster domestic industry, provided it is conditioned on criteria of cost-benefit evaluation, transparency, auditability, and equity in procurement processes.
It is important to emphasize that both the estimates of AI’s economic impact over the next four years and the public policy possibilities highlighted in this study represent potential impacts. Different choices — such as insufficient digital literacy policies, overly restrictive regulations, inequality in access to digital infrastructure, regulatory uncertainty, excessively fragmented rules across sectors or federal entities, and low integration between innovation, education, and productivity policies — could divert the Brazilian economy from this trajectory.
Conclusion
What did this study seek to answer?
This study sought to estimate the impact of artificial intelligence on Brazil’s GDP between 2027 and 2030. The central question was simple: how much can AI add to the Brazilian economy, and through which paths does this impact appear across different sectors? To answer this, the study adapted Acemoglu’s (2025) model to the Brazilian context, separating AI’s effects into two channels: increased labor productivity and increased capital efficiency.
And what did we find?
In the central scenario, AI could add up to R$986.7 billion to Brazil’s GDP by 2030, equivalent to roughly 7.6% of estimated 2026 GDP. This impact is not uniformly distributed: manufacturing industries, other service activities, and commerce concentrate the largest absolute gains. We also found important differences between the impact channels. On average, 65% of the estimated effect comes from the labor channel and 35% from the capital channel, but this proportion varies greatly across sectors. In agriculture, for example, 92% of the impact comes from capital, via more efficient machines, equipment, and productive infrastructure.
And why does this matter?
These results show that AI can also increase productivity, reduce waste, improve processes, and raise efficiency both in sectors that use a great deal of labor and in those that are more capital-intensive. This matters for the design of public policies: professional retraining, digital infrastructure, credit, support for small businesses, data governance, and regulatory security are not separate topics from the AI agenda. They are conditions for the potential estimated in this study to translate into real, broader, and better-distributed economic growth.
Recommendations for future studies
Measuring AI productivity gains in Brazilian companies. The study uses international parameters, such as an average gain of 27% per task. Future studies could verify the appropriateness of this assumption by sector, function, and firm size in Brazil.
Detailing the capital channel in agriculture and industry. Since a relevant part of the impact comes from machinery, sensors, robotics, and production systems, field research could measure where AI is already reducing losses, downtime, energy use, and input consumption.
Recalibrating the Brazilian adoption curve with observed data. The study assumes gradual adoption through 2030, with slower diffusion than in advanced economies. Longitudinal research could verify whether this trajectory is correct.
Breaking down the 12 sectors into more granular cuts. Sectoral aggregation helps with the macro view, but can hide relevant differences within services, commerce, industry, and public administration.
Estimating who gains and who loses in the transition. The study measures aggregate impact on GDP, but does not distribute gains and costs across occupations, regions, wages, and firm sizes. This analysis is essential for retraining and inclusion policies.
References
ACEMOGLU, D. The simple macroeconomics of AI. Economic Policy, v. 40, n. 121, p. 13–58, 2025.
ACEMOGLU, D.; JOHNSON, S. Power and progress: Our thousand-year struggle over technology and prosperity. [S. l.]: PublicAffairs, 2023.
BABINA, T. et al. Artificial intelligence, firm growth, and product innovation. Journal of Financial Economics, v. 151, p. 103745, 2024.
BANCO CENTRAL DO BRASIL. Relatório de mercado — Focus. Brasília: Banco Central do Brasil, maio 2026. Edição de maio de 2026.
BRYNJOLFSSON, E.; LI, D.; RAYMOND, L. R. Generative AI at work. Quarterly Journal of Economics, v. 140, n. 2, p. 889–942, 2025. (NBER Working Paper No. 31161, 2023).
BRYNJOLFSSON, E.; ROCK, D.; SYVERSON, C. Artificial intelligence and the modern productivity paradox: A clash of expectations and statistics. In: AGRAWAL, A.; GANS, J.; GOLDFARB, A. (ed.). The economics of artificial intelligence: An agenda. Chicago: University of Chicago Press, 2019. p. 23–57. (NBER Working Paper No. 24001).
CAZZANIGA, M. et al. Gen-AI: Artificial intelligence and the future of work. [S. l.]: International Monetary Fund, 2024. (IMF Staff Discussion Note SDN/2024/001).
CAZZANIGA, M. et al. Exposure to artificial intelligence and occupational mobility: A cross-country analysis. [S. l.]: International Monetary Fund, 2024. (IMF Working Paper No. WP/2024/116).
CERUTTI, E. et al. The global impact of AI: Mind the gap. [S. l.]: International Monetary Fund, 2025. (IMF Working Paper No. WP/2025/076).
COVINGTON & BURLING. Brazilian government opens consultation on artificial intelligence and data protection. [S. l.]: Covington Insights, nov. 2024.
DEICHMANN, U.; GOYAL, A.; MISHRA, D. Will digital technologies transform agriculture in developing countries? Agricultural Economics, v. 47, n. S1, p. 21–33, 2016. (World Bank Policy Research Working Paper No. 7669).
FAO. Digital agriculture and AI innovation roadmap. Roma: Food and Agriculture Organization of the United Nations, 2023.
FELTEN, E. W.; RAJ, M.; SEAMANS, R. Occupational, industry, and geographic exposure to artificial intelligence: A novel dataset and its potential uses. Strategic Management Journal, v. 42, n. 12, p. 2195–2217, 2021.
FELTEN, E. W.; RAJ, M.; SEAMANS, R. Occupational heterogeneity in exposure to generative AI. [S. l.]: SSRN, 2023. (SSRN Working Paper No. 4414065).
IBGE. Sistema de Contas Nacionais: Tabela de Recursos e Usos 2019. Rio de Janeiro: Instituto Brasileiro de Geografia e Estatística, 2021.
ILO. Generative AI and jobs: A refined global index of occupational exposure. Genebra: International Labour Organization, 2025. (ILO Working Paper No. 140).
NAYYAR, G. et al. Digitalization and inclusive growth: A review of the evidence. [S. l.]: World Bank, 2024. (World Bank Policy Research Working Paper No. 10941).
NOY, S.; ZHANG, W. Experimental evidence on the productivity effects of generative artificial intelligence. Science, v. 381, n. 6654, p. 187–192, 2023.
OECD. Bridging the AI skills gap: Is training keeping up? Paris: OECD Publishing, 2025a.
OECD. AI adoption by small and medium-sized enterprises. Paris: OECD Publishing, 2025b.
OECD. AI in public procurement. In: OECD. Governing with artificial intelligence. Paris: OECD Publishing, 2025c.
SIDI. PL 2338/2023: The impacts of regulating artificial intelligence in Brazil. SiDi Blog, 23 out. 2025.
UNCTAD. Brazil launches the Brazilian artificial intelligence plan 2024–2028. [S. l.]: Investment Policy Monitor, UNCTAD, 2024.
UNESCO. Brazil country profile. Global AI Ethics and Governance Observatory, UNESCO, 2024. Disponível em: https://www.unesco.org/ethics-ai/en/brazil. Acesso em: 19 maio 2026.
WEBB, M. The impact of artificial intelligence on the labor market. Stanford: Stanford University, 2019. (SSRN Working Paper No. 3482150).
WORLD BANK. Artificial intelligence in the public sector: Maximizing opportunities, managing risks. Washington, DC: World Bank Group, 2021.
ZENG, S. et al. How does the development of rural broadband in China affect agricultural total factor productivity? Frontiers in Sustainable Food Systems, v. 8, p. 1332494, 2024.
Methodology Annex
Research Question
What is the sectoral impact of artificial intelligence on Brazil’s GDP over four years (2027–2030)?
Methodology Summary
Application of the Acemoglu (2025) model to Brazil, extended to incorporate two impact channels (labor and capital), using data from the Continuous PNAD 2023, RUT IBGE 2019, AIOE (Felten et al.), C-AIOE (Cazzaniga et al./IMF), and AI patent scores (Webb, 2020). Adoption trajectory via a Gompertz S-curve. The impact of AI on GDP is estimated through two channels (labor and capital) and aggregates sectoral effects using weights derived from Hulten’s Theorem (each sector’s share in total output).
Felten et al. (2021/2023) — AIOE by SOC occupation, harmonized with PNADc 2023 (IBGE);
Cazzaniga et al. (IMF SDN 2024/001) — C-AIOE in ISCO-08; Webb (2020) — USPTO patent scores, harmonized with CNAE;
Capital exposure: Webb (2020) — scores from 16 million USPTO patents by capital type;
Sectoral weights (Hulten): Resources and Uses Table (RUT) IBGE 2019, with 12 aggregated activities.
Discount rate: Selic of 13% per year and real GDP for 2026 estimated at R$12.9 trillion, Focus Report (Central Bank, May/2026).
Data Analysis
The analytical design adopted in this study is based on the application and extension of Acemoglu’s (2025) macroeconomic framework to the Brazilian structural reality. The model was chosen because it allows isolating the impact of Artificial Intelligence through two simultaneous transmission channels: labor factor productivity (cognitive exposure) and capital factor efficiency. The number and definition of the economic activities analyzed follow directly from the Resources and Uses Table (RUT) calculated by the Brazilian Institute of Geography and Statistics (IBGE), totaling 12 major economic sections.
For data analysis and numerical calculations, the following references, steps, and assumptions were used:
• Aggregation of exposure by CNAE section: The first step was to map the level of vulnerability and complementarity of the economy to the new technology. For the labor channel, the metric of cognitive exposure by occupation based on Felten et al. (AIOE) and adjusted by the IMF categories (C-AIOE) was used. For the capital channel, the exposure scores based on AI patents developed by Webb (2020) were adopted. Both metrics were aggregated and weighted at the sectoral level to correspond exactly to the sections of the National Classification of Economic Activities (CNAE) used by IBGE.
• Hulten weights from the RUT: To measure how sectoral productivity shocks translate into impact on overall GDP, the model applies economic weights grounded in Hulten’s Theorem. Under this economic principle, the aggregate impact of AI on the economy is calculated as the weighted average of each sector’s impacts, using as weight the stable share of each activity in the country’s total gross value added, extracted directly from the IBGE RUT.
• Dynamic simulation via Gompertz: Since technological adoption by companies and workers does not occur instantaneously, the model distributes the potential impact over the four-year time horizon (2027–2030) through a Gompertz sigmoid curve, with an inflection point in 2027, adoption speed of 0.30 (labor channel) and 0.25 (capital channel). By 2028, 25.9% (labor) and 27.7% (capital) of the total potential had already been realized. By 2030, this utilization reaches 66.6% (labor) and 62.4% (capital). This mathematical specification simulates the real trajectory of innovation diffusion, characterized by an initial period of slow learning, followed by a phase of exponential market acceleration and a subsequent stabilization upon reaching maturity.
• Reference scenario and Focus projections: The construction of the counterfactual baseline (the scenario for the Brazilian economy without the AI effect) was structured from the projected GDP and the real GDP growth rates published in the median of market expectations in the Focus Report of the Central Bank of Brazil. The annual increment estimated by the model for the period from 2027 to 2030 is overlaid on this reference trajectory.
• Present value calculation and Selic discounting: To consolidate the accumulated economic gain over the four-year period into current values, the Net Present Value (NPV) of future GDP flows generated by AI was calculated. As the intertemporal discount factor to bring these values to the reference year, the basic interest rate (Selic) was used, also extracted from the official expectations of the Focus Report.
The central scenario of this study is calibrated based on the Brazilian productive structure (RUT/IBGE 2019) and the international literature (Acemoglu, 2025; Webb, 2020). It is assumed that 23% of cognitive tasks exposed to AI correspond to activities where the technology can enhance labor productivity, by acting in a complementary way to the functions performed by workers, and not necessarily as a substitution mechanism. For these tasks, an average productivity gain of 27% is considered. In the capital channel, it is assumed that 15% of the stock is affected by AI, with an efficiency gain of 18%. For the public sector, a discount of 50% is applied, reflecting slower adoption due to institutional factors. The diffusion trajectory follows an adoption curve with an inflection point in 2027, reaching, in 2030, 57.8% of the estimated potential for the labor channel.
Bias Reduction Procedure
Sensitivity analysis: The model addresses technological uncertainty through controlled variation of key parameters (such as the task substitution rate and the marginal efficiency gain), generating alternative scenarios around the central scenario.
Cross-Model Validation: The results and elasticities generated for the Brazilian context were tested and methodologically validated against the original predictions of Acemoglu (2025) for mature economies and the parameters of Cazzaniga et al. (2024) for emerging markets, ensuring international theoretical consistency.
Other Methodological Limitations
Structural lag of the input-output matrix: The use of value-added weights based on the Resources and Uses Table (RUT) of 2019 establishes an assumption of stability in the intrasectoral composition of the Brazilian economy. Structural changes occurring in the post-pandemic composition are not fully captured due to the statistical publication lag of the matrix.
High macroeconomic aggregation: The model operates at the aggregation level of 12 major sections of the IBGE National Accounts System. This constraint prevents the observation of deep asymmetries and technological dynamics existing between more granular subsectors within the same segment (for example, the heterogeneity between traditional retail commerce and high-technology e-commerce).
Adoption of indirect measures (proxies) for capital: The intensity of exposure of fixed assets and productive infrastructure is based on the USPTO patent indices compiled by Webb (2020). This approach acts as an approximation of the direction of industrial innovation investments, and does not constitute a direct measurement of the stock of physical capital goods actually installed in the Brazilian industrial base.
Calibration by global parameters: Due to the scarcity of AI productivity experimental data specific to firms in developing countries, the capital efficiency gain parameters and the task substitution ceiling are based on economic literature focused on the United States and Europe, assuming a homogeneous absorption capacity.
Software Used
Python 3.9, Jupyter Notebook, and Claude Code for estimating the effects of AI on the Brazilian economy, as well as the sectoral decomposition of effects.
R for manipulation of Continuous PNAD data and its harmonization with other databases related to the labor market.
Google Workspace Suite for text editing, spreadsheets, and charts.
Gemini and ChatGPT 5.3 for brainstorming and systematization of information.
Adobe CC Suite for layout and finalization of charts and illustrations.
Ethical Guidelines
This research was funded by OpenAI. To ensure the integrity of this work, the authors developed, conducted, and analyzed the study independently, without any contribution or interference from the company, which also did not influence or interfere with the interpretation of the results.
The authors maintain full professional independence and responsibility for the content and conclusions of this work.
Respect for Privacy and Confidentiality: The data used are in the public domain and were obtained from accessible sources (IBGE, Continuous PNAD, AIOE), without violating the privacy or confidentiality of any individual or institution, with replicable methodology via repository.
Responsible Use of Public Data: Although the data analyzed are public, their use was carried out in a responsible and ethical manner, with the exclusive objective of academic research.
Non-discrimination and Respect for Diversity: The research was conducted in a manner that respects diversity and avoids any form of discrimination.