Reglab Trust and Safety Index
Reglab Trust & Safety Index
Report 2 | Q3/2026
The Reglab Index is an applied-research initiative that measures how Brazilian users perceive trust and safety in the digital environment. The Index spans different segments of the digital economy, reflecting the diversity of uses and functions of platforms in everyday life, and each category is analyzed independently, respecting its specificities of use, risk and perceived value. Learn more at https://reglab.com.br/indice-de-confianca-reglab/.
| 1,099 respondents |
Brazilian online population, +18 years old |
October 2-9, 2026 fieldwork |
26 platforms evaluated |
95% confidence level |
±3pp margin of error |
1. Overview
1.1. Reglab Index — Perceived Trust & Safety
| The Reglab Index is a composite indicator that summarizes, in a single number, trust in five broad categories of platforms (social media, streaming, platform economy, artificial intelligence and e-Government) and across four Trust & Safety dimensions (general trust, information integrity, data protection and adolescent protection). |
The Reglab Index remained stable across the first, second and third quarters of 2026. In practice, Brazilians’ overall perception of trust and safety in the digital environment did not change from one round to the next.
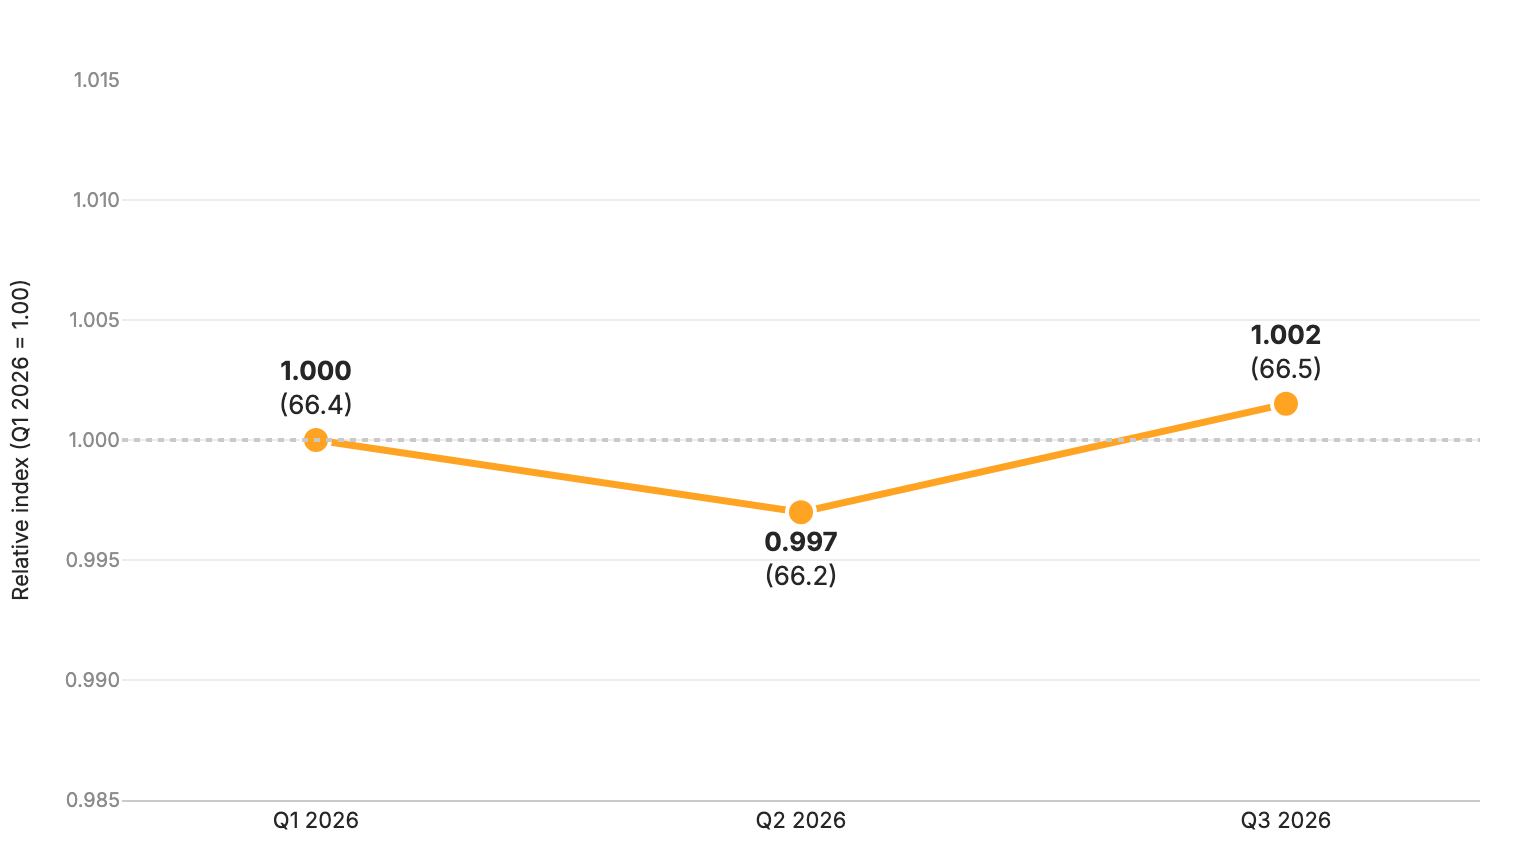
Figure 1 Trajectory of the Reglab index (Q1/2026 = 1.00).
Source: Reglab.
Stability is, in itself, a result. In six months, three different samples arrived at practically the same number. In addition, the ordering of platforms and dimensions was repeated almost unchanged. This indicates that the Index captures a consolidated perception among the online population, rather than the mood of a particular sample or moment.
1.2. Index by category
No category moved beyond the margin of error between Q1 2026 and this edition, but the trajectories since the start of the series show an interesting pattern: some of the small movements seen in the previous round tended to reverse. Social Media recovered from its slight dip (from 0.983 to 1.003), and Artificial Intelligence went the opposite way, giving back its slight gain and returning close to its Q1 level (from 1.013 to 1.003). Digital Government is the exception, continuing a slow rise since Q1 2026 (from 1.010 to 1.017). Finally, Platform Economy (1.004) and Streaming & Entertainment (0.992) stayed practically where they were. These are small variations, which for now remain signals to watch rather than confirmed changes.
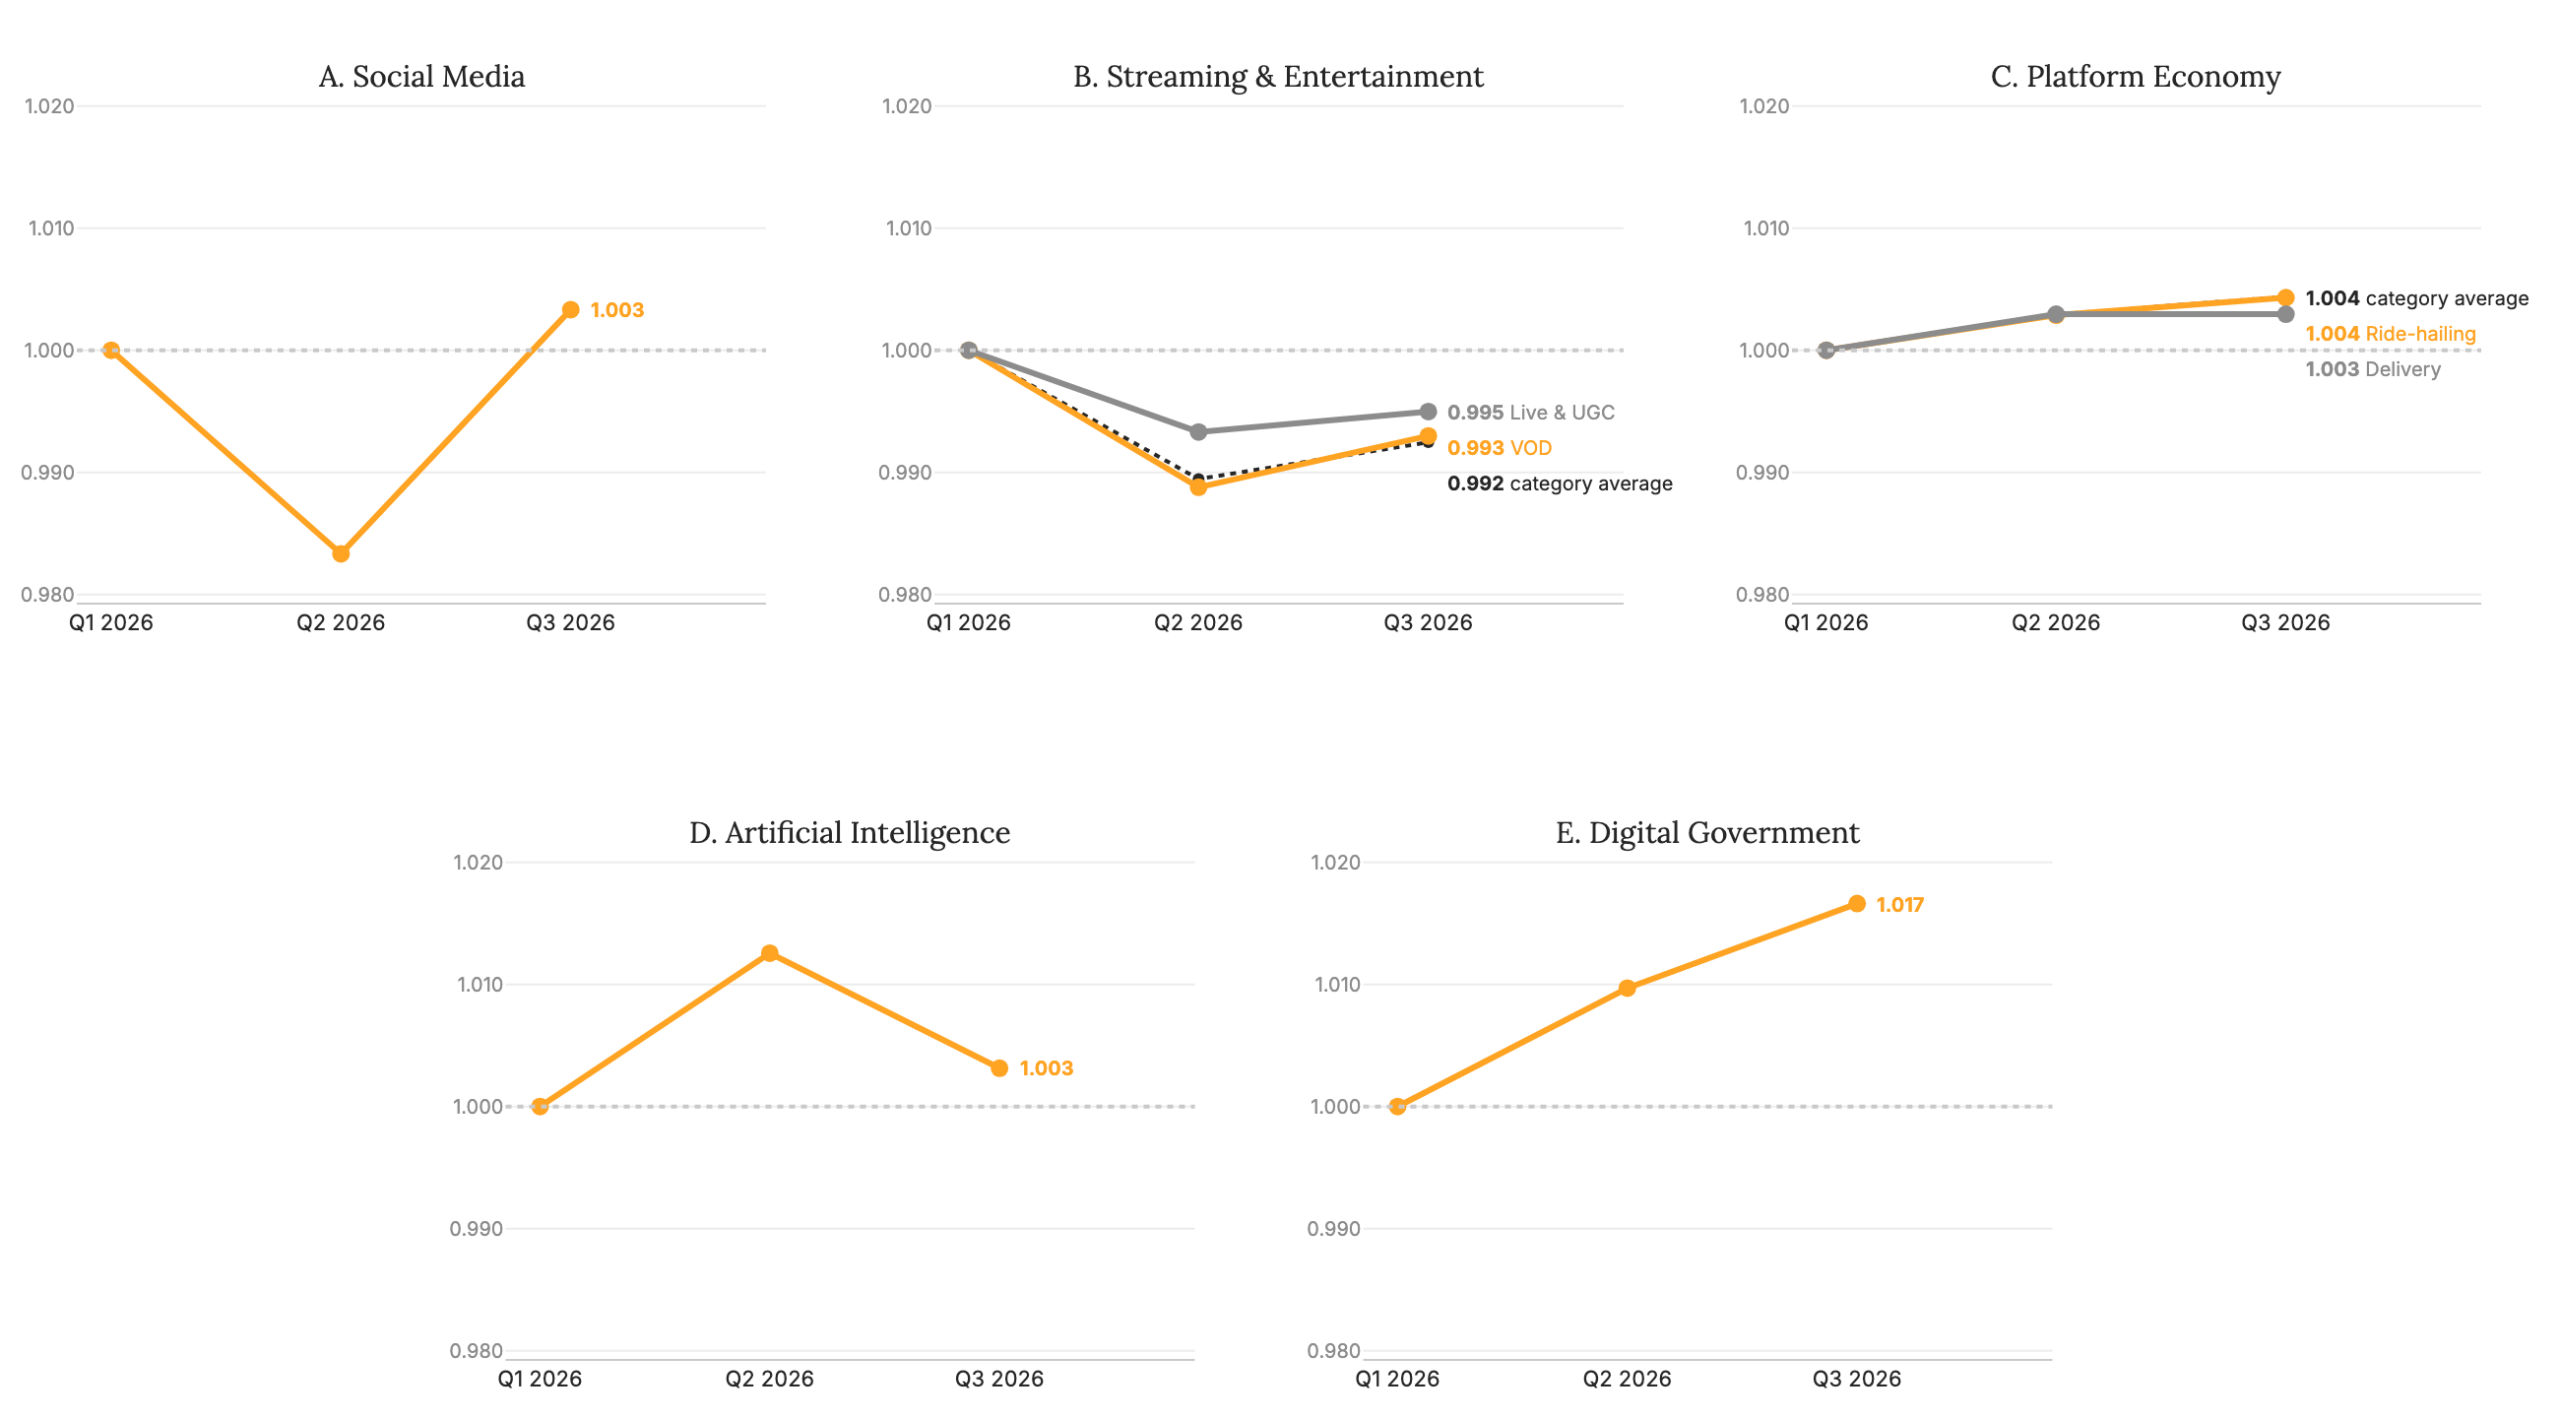
Figure 2 Reglab Index trajectory by category and subcategory (Q1/2026 = 1.00).
Source: Reglab. Note: each unit starts from its own Q1 2026 value (1.00); the figure shows how much it moved, not its level. Small variations are signals to watch.
1.3. Trust and Safety Dimensions
The four dimensions measure different aspects of Trust & Safety: general trust, information integrity, data protection and adolescent protection. All dimensions remain stable. In users’ perception, adolescent protection is still the weak spot of the digital environment, and it is the only dimension that remains below its Q1 2026 level.
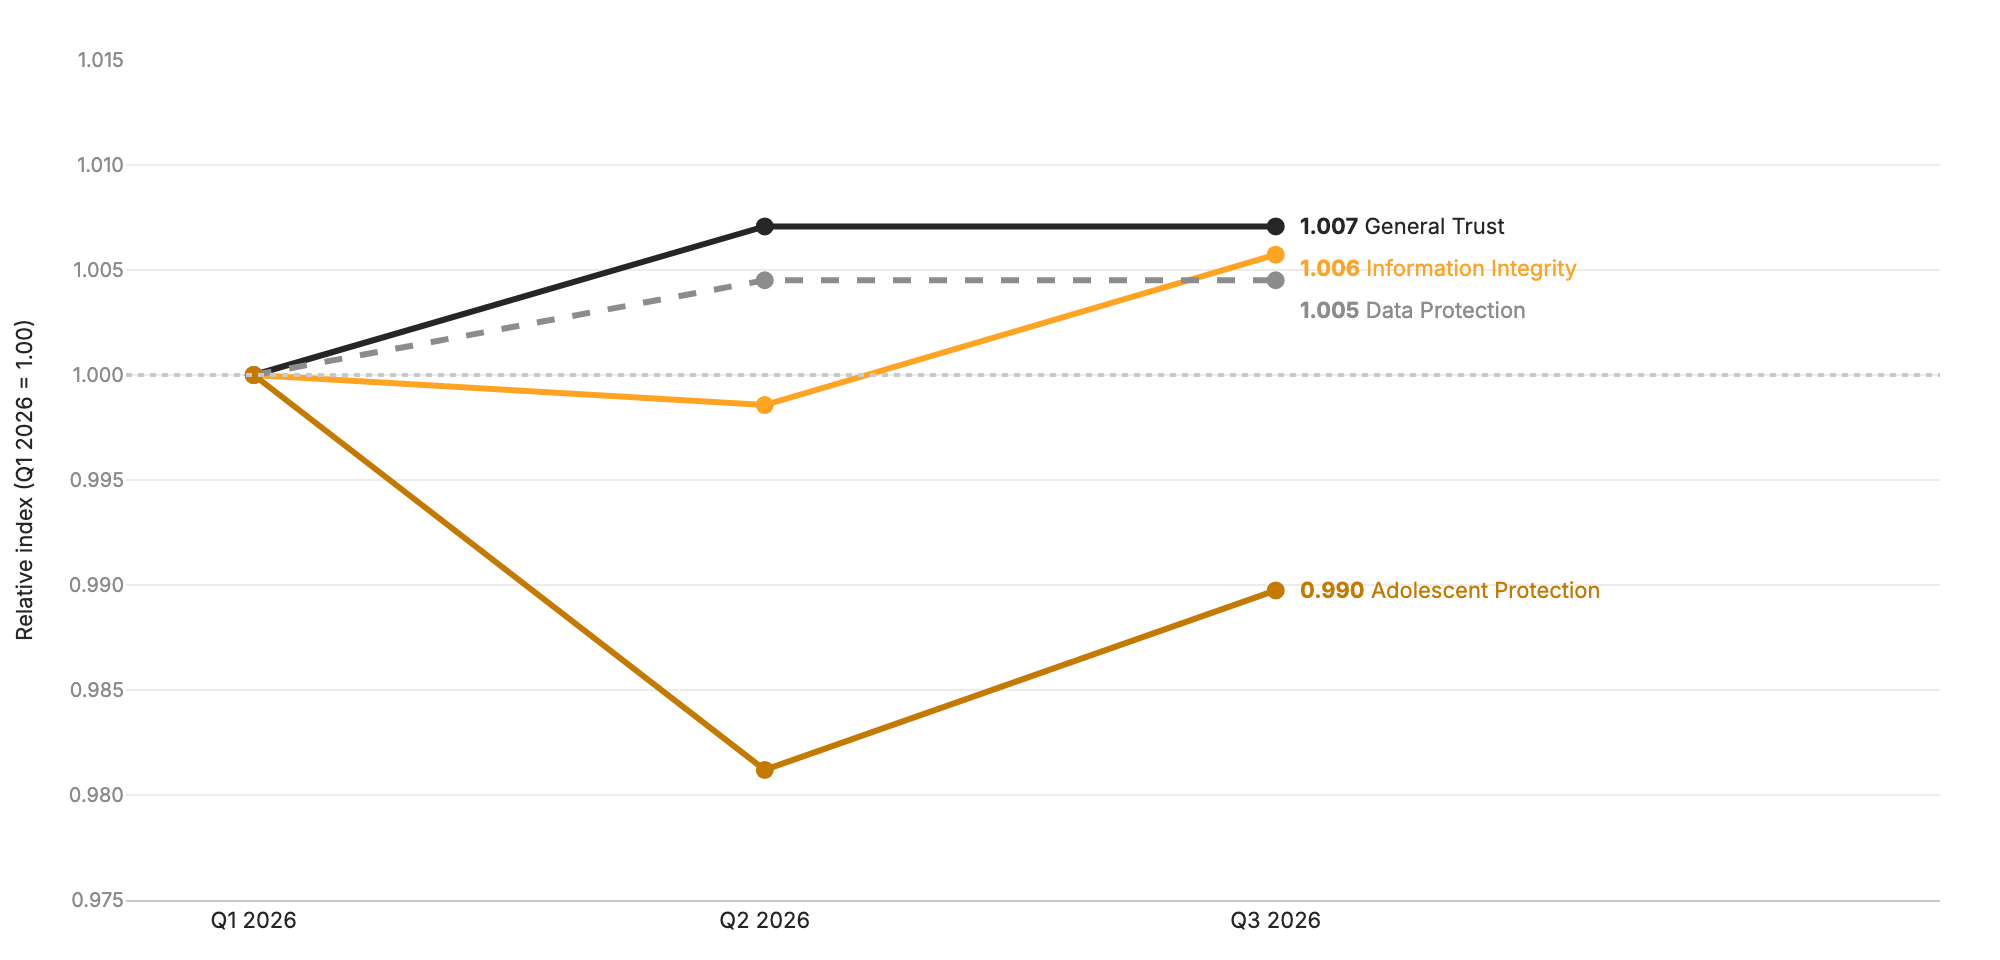
Figure 3 Trust by dimension over time (Q1 2026 = 1.00).
Source: Reglab. Note: general trust, information integrity, data protection and adolescent protection.
The downward signal in adolescent protection flagged in Q2 2026 did not deepen, however: the dimension went from 0.981 to 0.990. In any case, all differences between rounds remain within the margin of error.
1.4. Categories vs. Dimensions
Within categories, too, the Q2 movements tended to reverse. Adolescent Protection recovered partially, but not in the same way across all categories. In Social Media, the dimension returned practically to its Q1 level (from 0.960 in Q2 to 0.996 in Q3). In Streaming & Entertainment, the recovery was smaller (from 0.966 to 0.981), and the dimension remains the one that has fallen most within the category. In Artificial Intelligence, the movement was the opposite: Adolescent Protection became the dimension with the largest decline in the category (0.979), and the Q2 gains in Data Protection (from 1.024 to 1.006) and General Trust (from 1.021 to 1.012) lost strength. Digital Government is the exception, with continued gains in General Trust (1.024) and Data Protection (1.022), and Adolescent Protection practically at its Q1 level (1.002). As with the dimensions overall, all of these movements are small and within the margin of error.
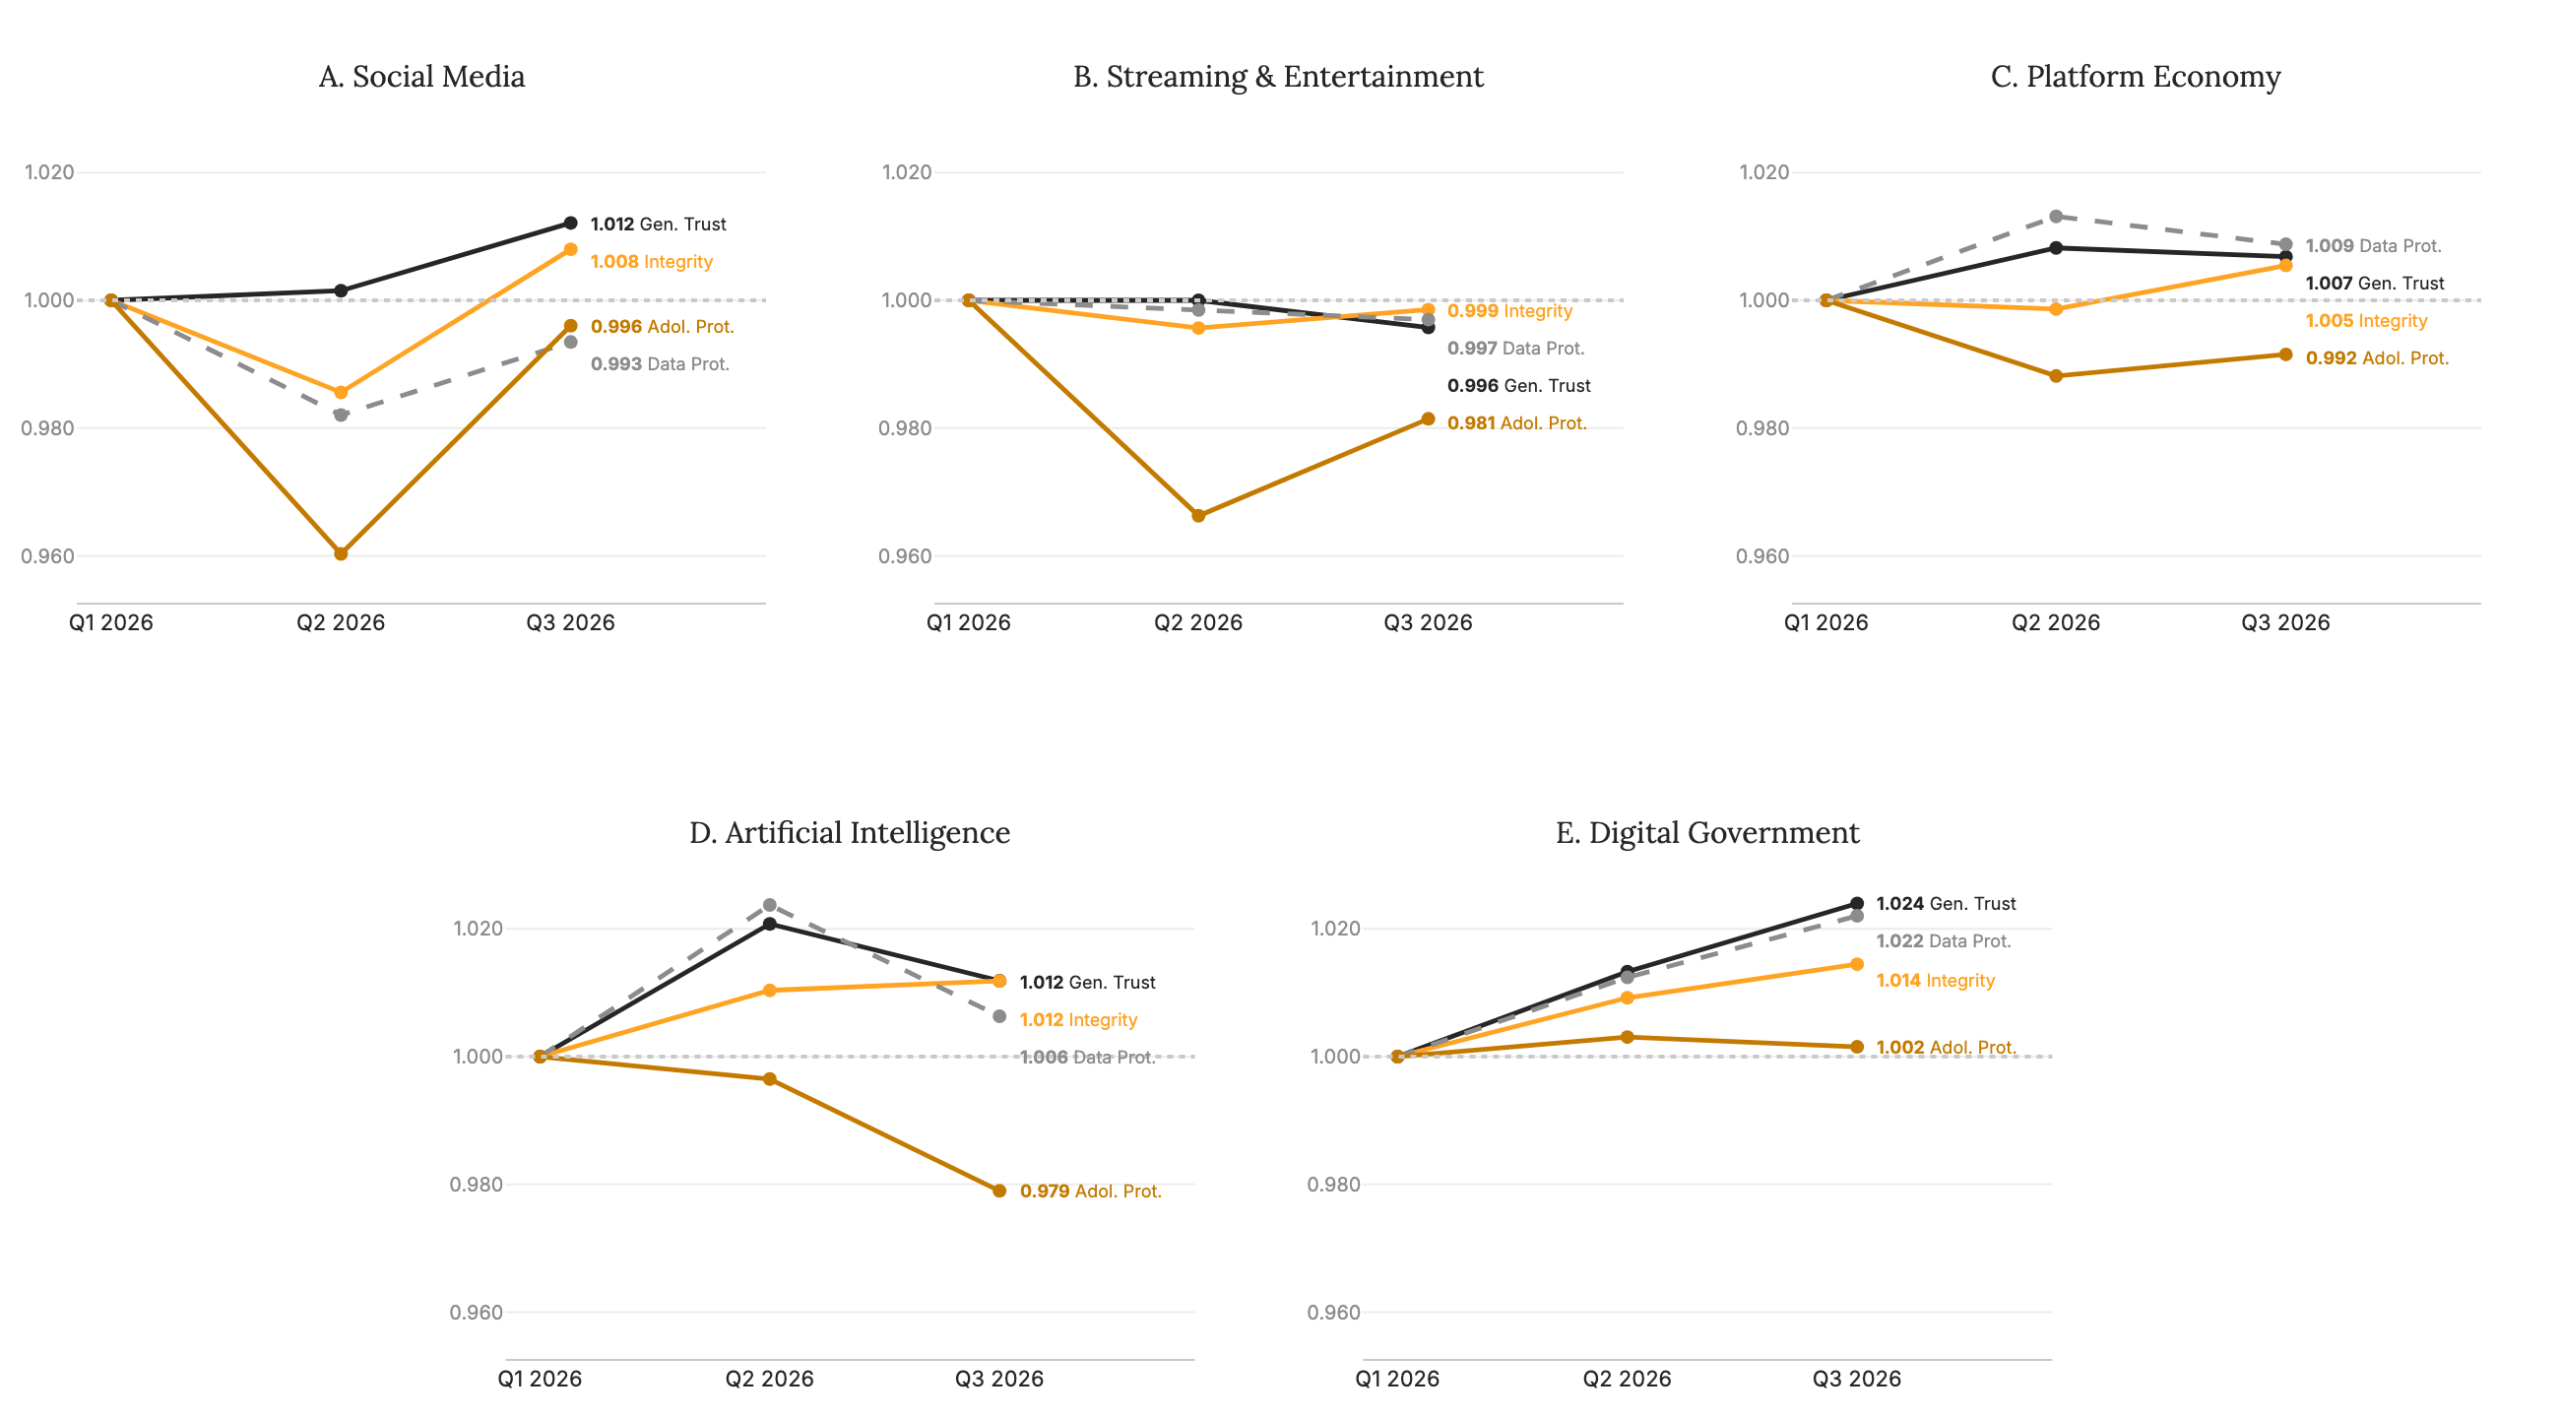
Figure 4 Dimension profile within each category (Q1 2026 = 1.00).
Source: Reglab. Note: in most categories, adolescent protection is the dimension that has gained least or fallen most since Q1.
1.5. Demographics
Social class remains what most separates Brazilians in their trust in the digital environment, and it is also the most stable pattern in the Index. Class A continues to show the highest trust (75.1), followed by class B (67.9), with classes C (64.3) and D-E (64.5) practically tied. The gap between the two ends stayed at around 10 points in all three rounds. The only movement came from class B: the convergence with class A observed in Q2 2026 reversed, and class B returned to its Q1 level.
Across age groups, the picture changed more. The difference between millennials and Generation Z, one of the theses of the Q1 survey (Baseline Survey), no longer appears: young people aged 18 to 24 (68.0) caught up with those aged 25 to 34 (67.9). At the other end, Brazilians aged 45 to 54 rose for the second consecutive round, from 64.0 to 66.4, and the 55-and-over group now has the lowest trust of all age groups (64.7). As these subgroups are smaller, these movements are still signals to watch.
Gender, in turn, barely separates Brazilians in the overall index: men (67.6) and women (65.5) remain close, with a difference within the margin of error. It is in specific dimensions that they diverge, as shown in Section 2.1.
Finally, the regions keep the Q2 pattern, with the South (68.6) and Northeast (67.5) at the top, the Central-West (65.6) and Southeast (65.5) in the middle, and the North (64.6) with the lowest value. Two trajectories stand out: the Central-West recovered part of its Q2 decline, and the South is the region that has advanced most since the start of the series, rising in every round. As regional samples are smaller, especially in the North and Central-West, these variations are also signals to watch.
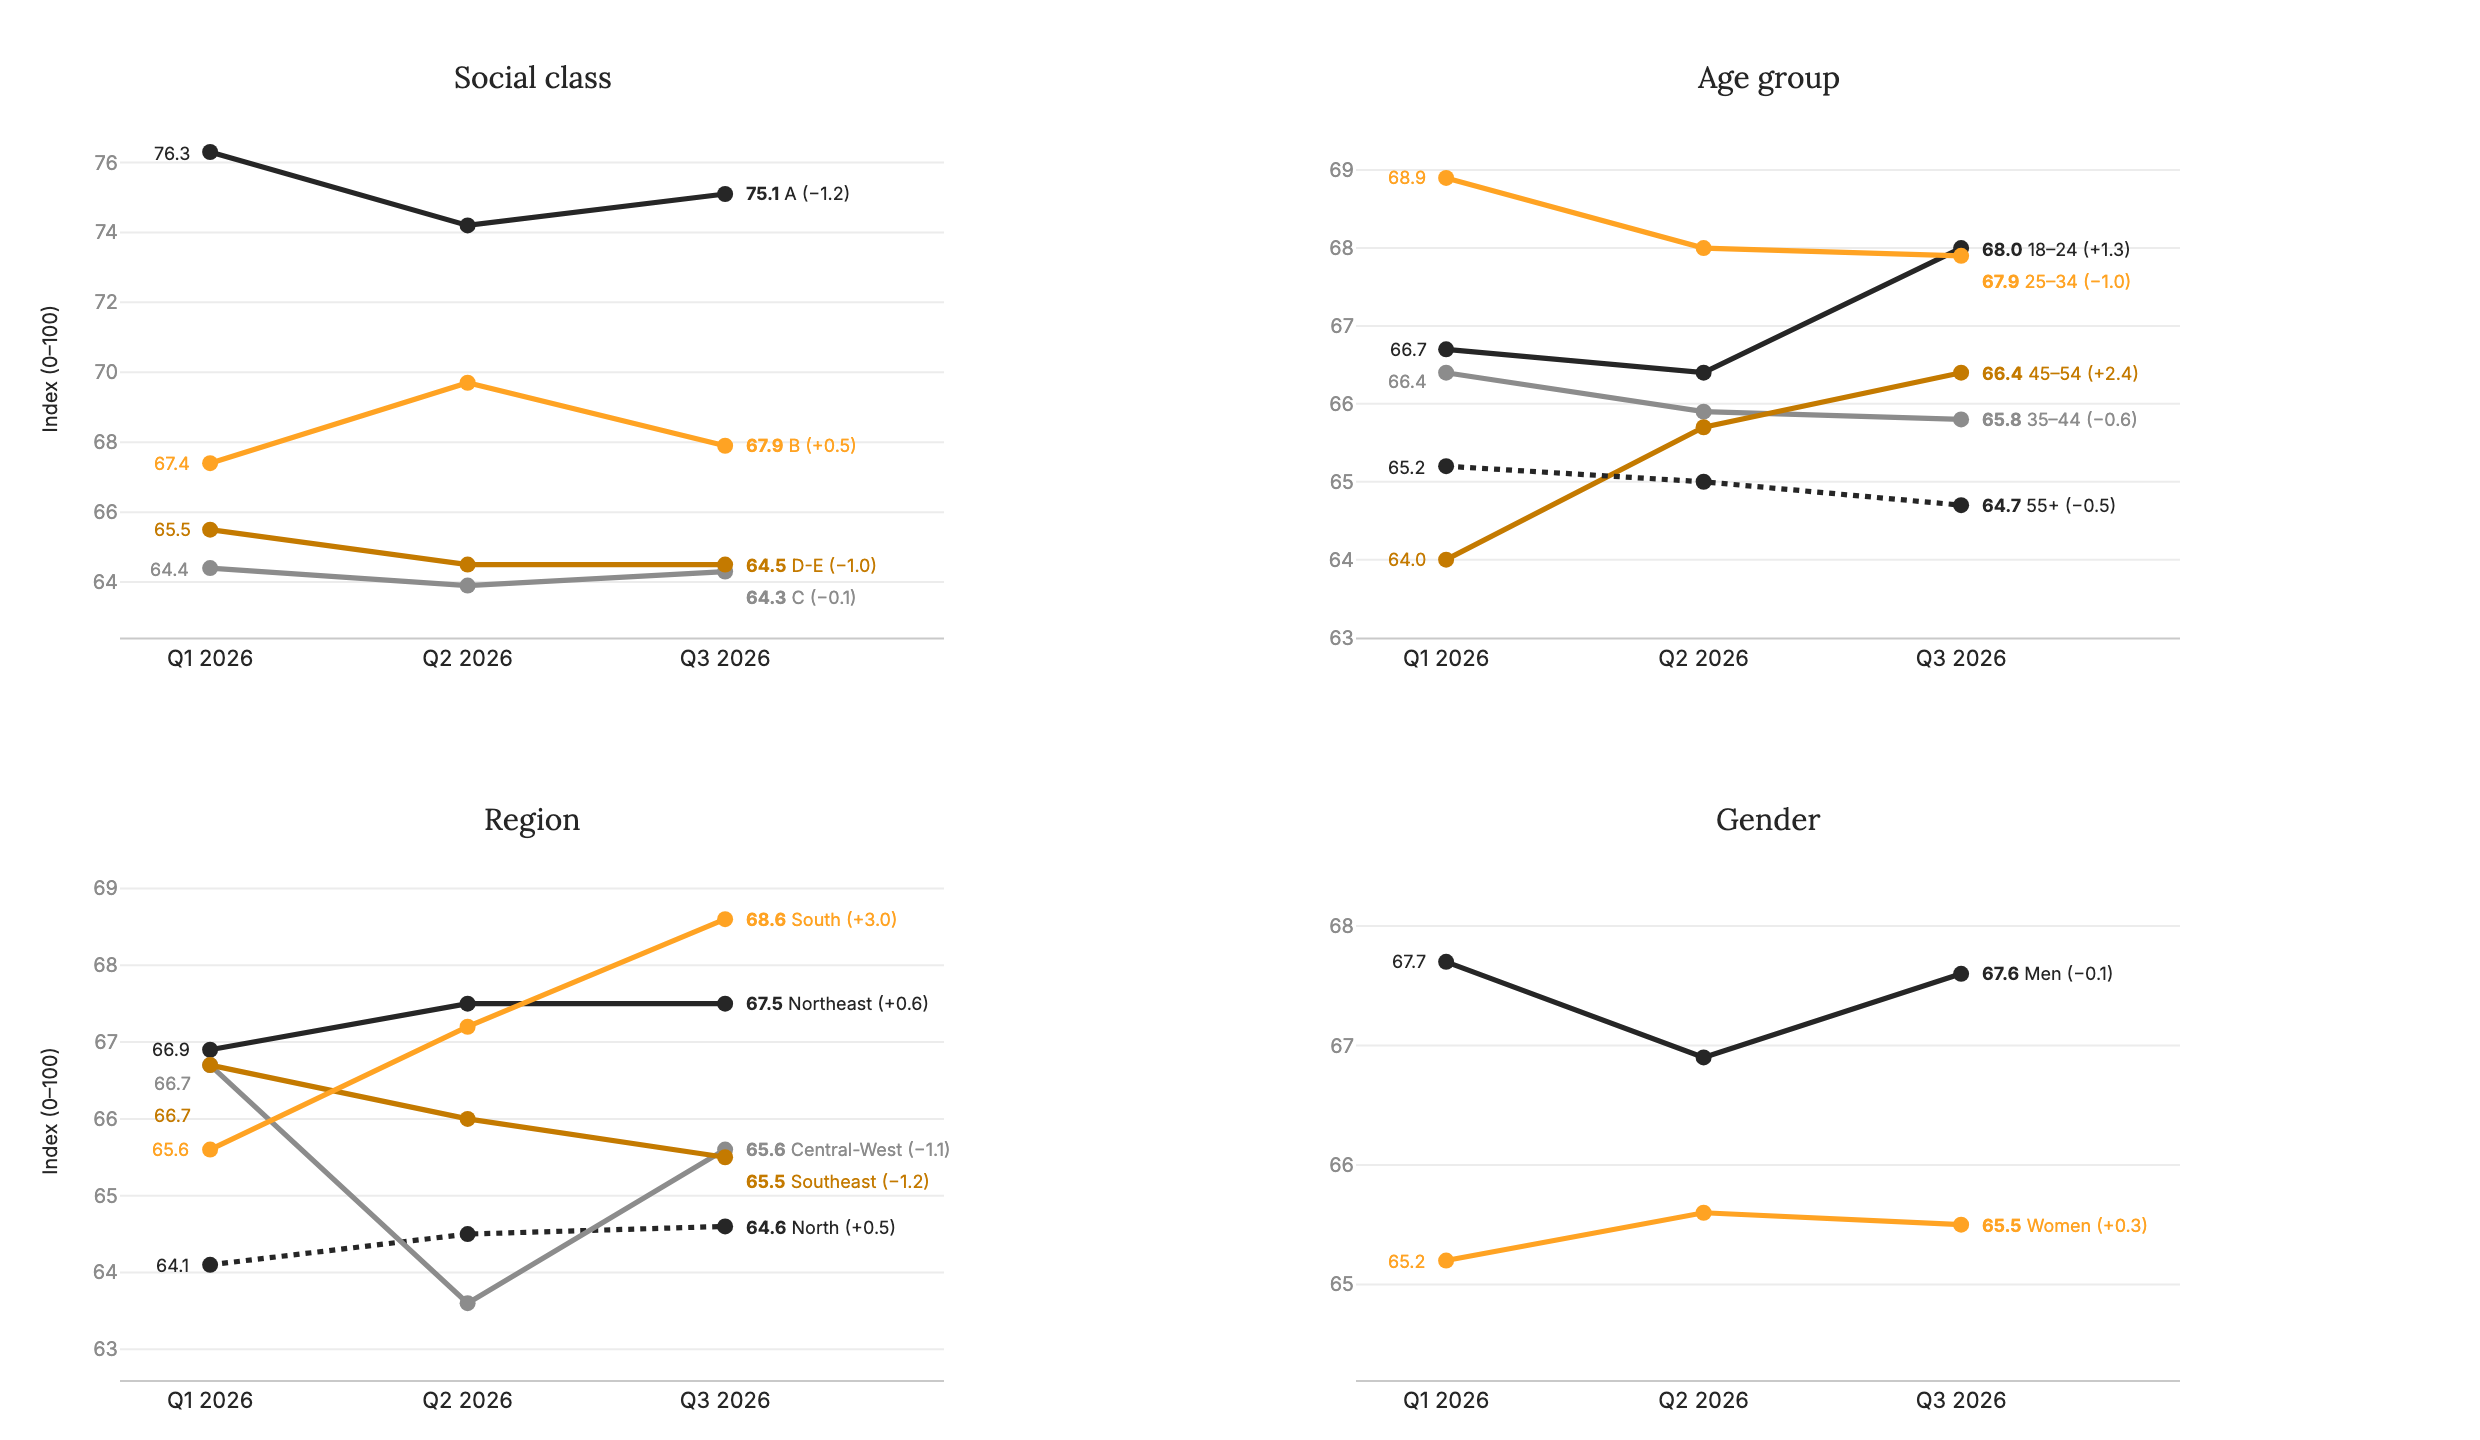
Figure 5 Trust index by social group: class, age, gender and region (absolute values).
Source: Reglab. Note: 0–100 scale. Smaller groups (class A, North, Central-West) carry greater uncertainty.
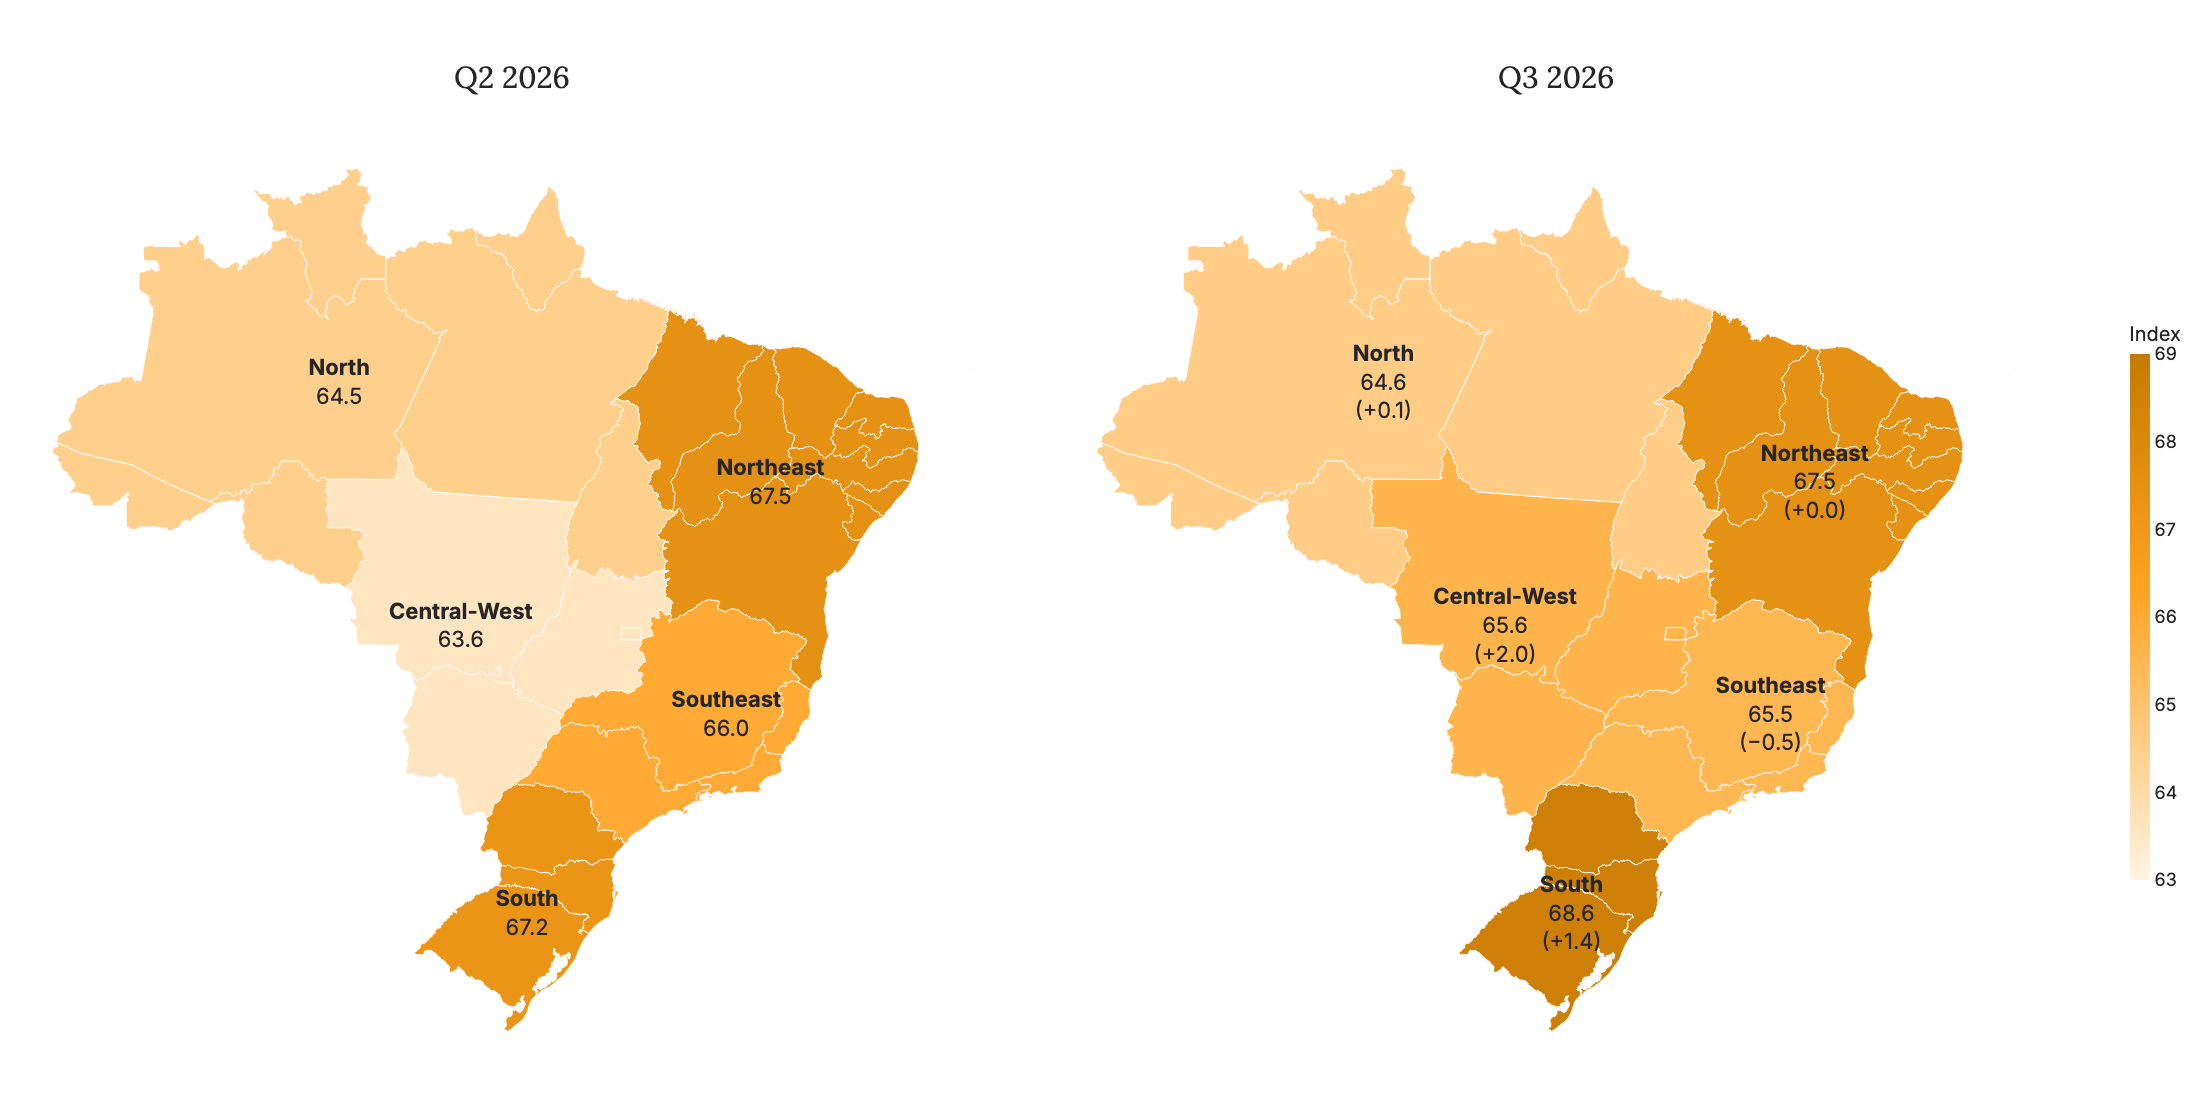
Figure 6 Trust index and change by region, Q2 and Q3 2026 (absolute values).
Source: Reglab. Note: regional samples are the smallest in the study, so changes should be read with caution. Values in parentheses show the change from Q2.
1.6. Awareness
Before closing the overview, a look at awareness: how many people actually know each platform.
Platform awareness remains close to saturation: most platforms are known by more than 90% of online Brazilians, and YouTube (99.9%), Gov.br (99.7%) and Instagram (99.5%) are close to 100%. The exception remains artificial intelligence, the category in which awareness grows fastest. AI awareness went from 84.7% in Q1 2026 to 86.5% in Q2 and 89.5% now, the largest increase of any category in this edition. The gain was driven by the less well-known tools, such as Claude (from 72.3% to 81.2% since Q1) and Perplexity (from 75.1% to 80.8%). Outside AI, Twitch followed the same path (from 81.5% to 85.7%).
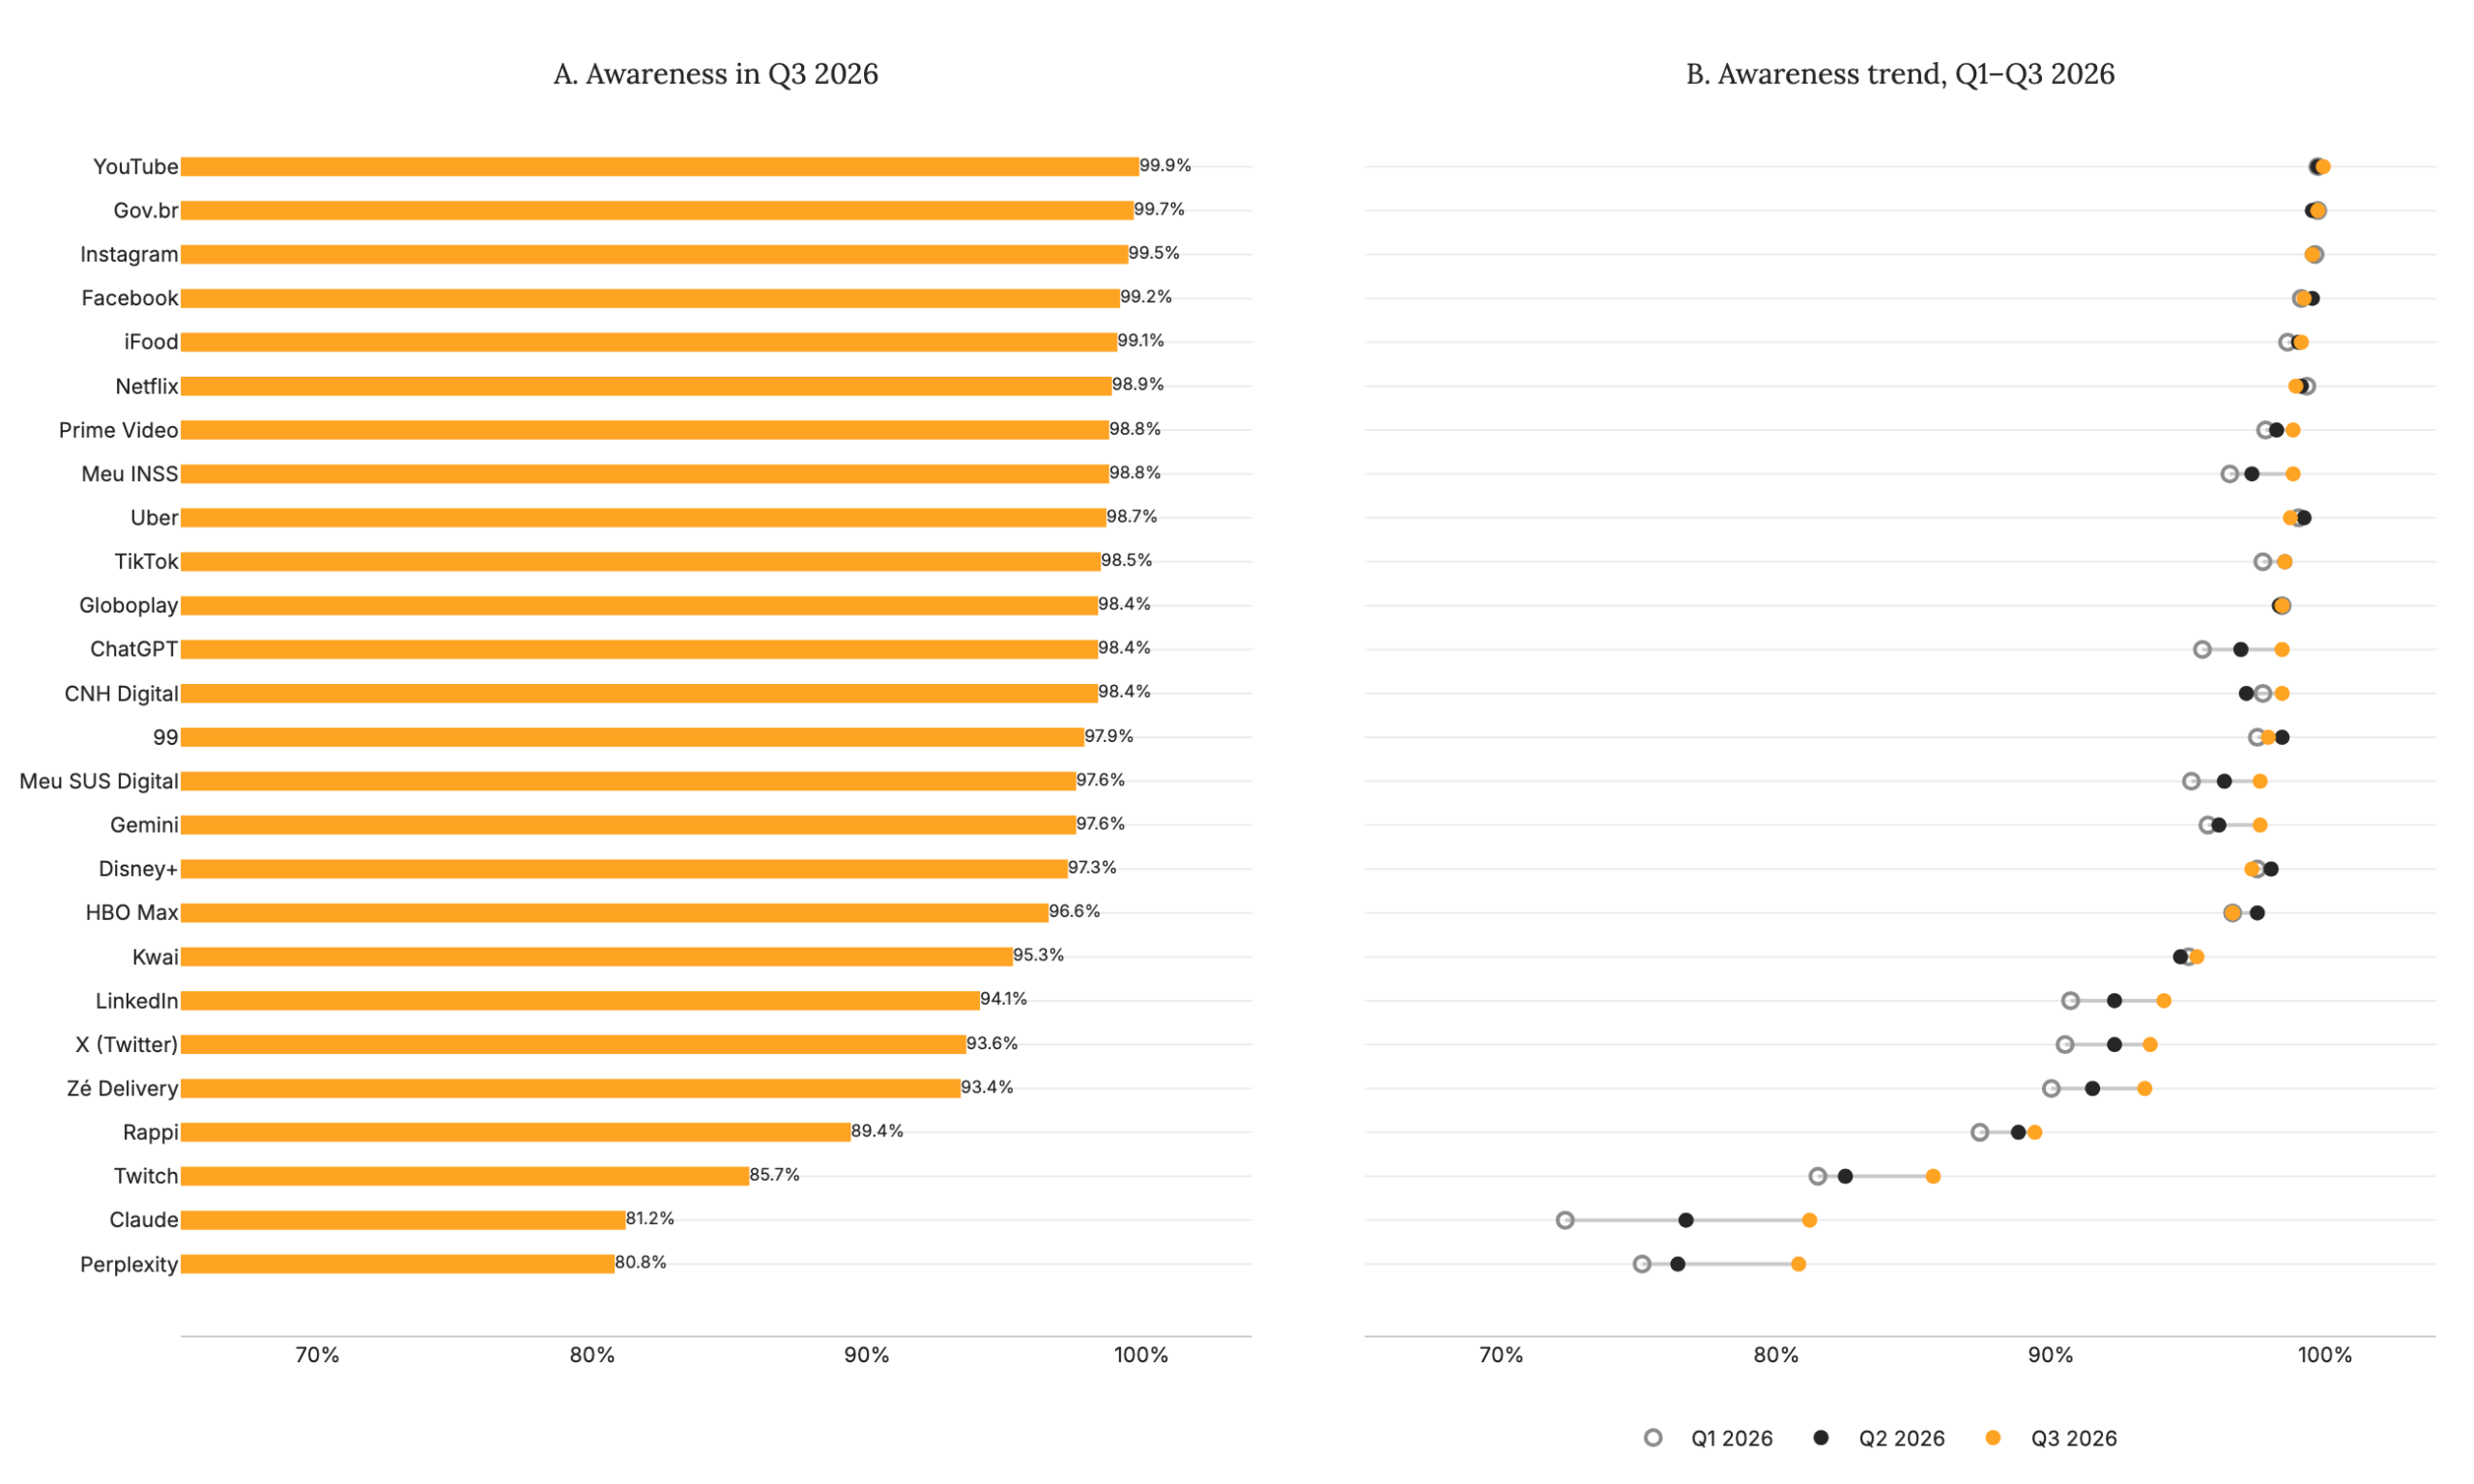
Figure 7 Awareness by platform (Q1, Q2 and Q3 2026).
Source: Reglab. Note: % of respondents who report knowing each platform. Panel A shows awareness in Q3 2026; panel B, the change since Q1. Platforms ordered by Q3 awareness.
What changed was who drove the increase in this edition. In Q2, the spread of AI awareness reached classes D-E, driven by their gain (from 79.4% to 84.4%). In this edition, the gain came from classes A (from 92.4% to 97.3%) and C (from 84.7% to 87.8%), while classes D-E remained practically flat (around 85.4%, a change within the margin of error). Because the gain came from one class on each side (A and C), the gap between groups A/B and C/D-E in AI awareness remains stable at 6 percentage points. At the extremes, however, the gap widened again: with classes D-E flat, the difference between classes A and D-E went from 8.0 to 11.9 percentage points, as detailed in Section 2.4.
Knowing, trusting and using are different stages in people’s relationship with a technology. The literature on the diffusion of innovations describes adoption as a process in which first contact with something new (knowledge) precedes forming an opinion about it (persuasion), and only later turns into a decision and actual use (implementation) (Rogers, 2003). The Reglab Index tracks the first two stages: it measures how many people know each tool (awareness) and how they perceive its trustworthiness and safety, but not how many actually use it. The gain among classes D-E in Q2 and the stagnation in this edition therefore refer to those who have heard of AI, not to those who have made it part of their daily lives. The distinction matters because barriers to actual use tend to weigh more heavily on lower-income classes.
Not even the step from knowing to trusting is automatic. As the section on artificial intelligence shows, people who have just become aware of a tool assess it more cautiously: among respondents followed since Q2, newly known tools received an average of 51.0 points, compared with 60.5 for the tools the same person already knew. Because this involves a small group (28 people), the result should be read as indicative. And among those who answered all three rounds, trust in AI rose in Q2 (from 1.00 to 1.074) and fell back in this edition (1.020), even though awareness of the tools kept growing.
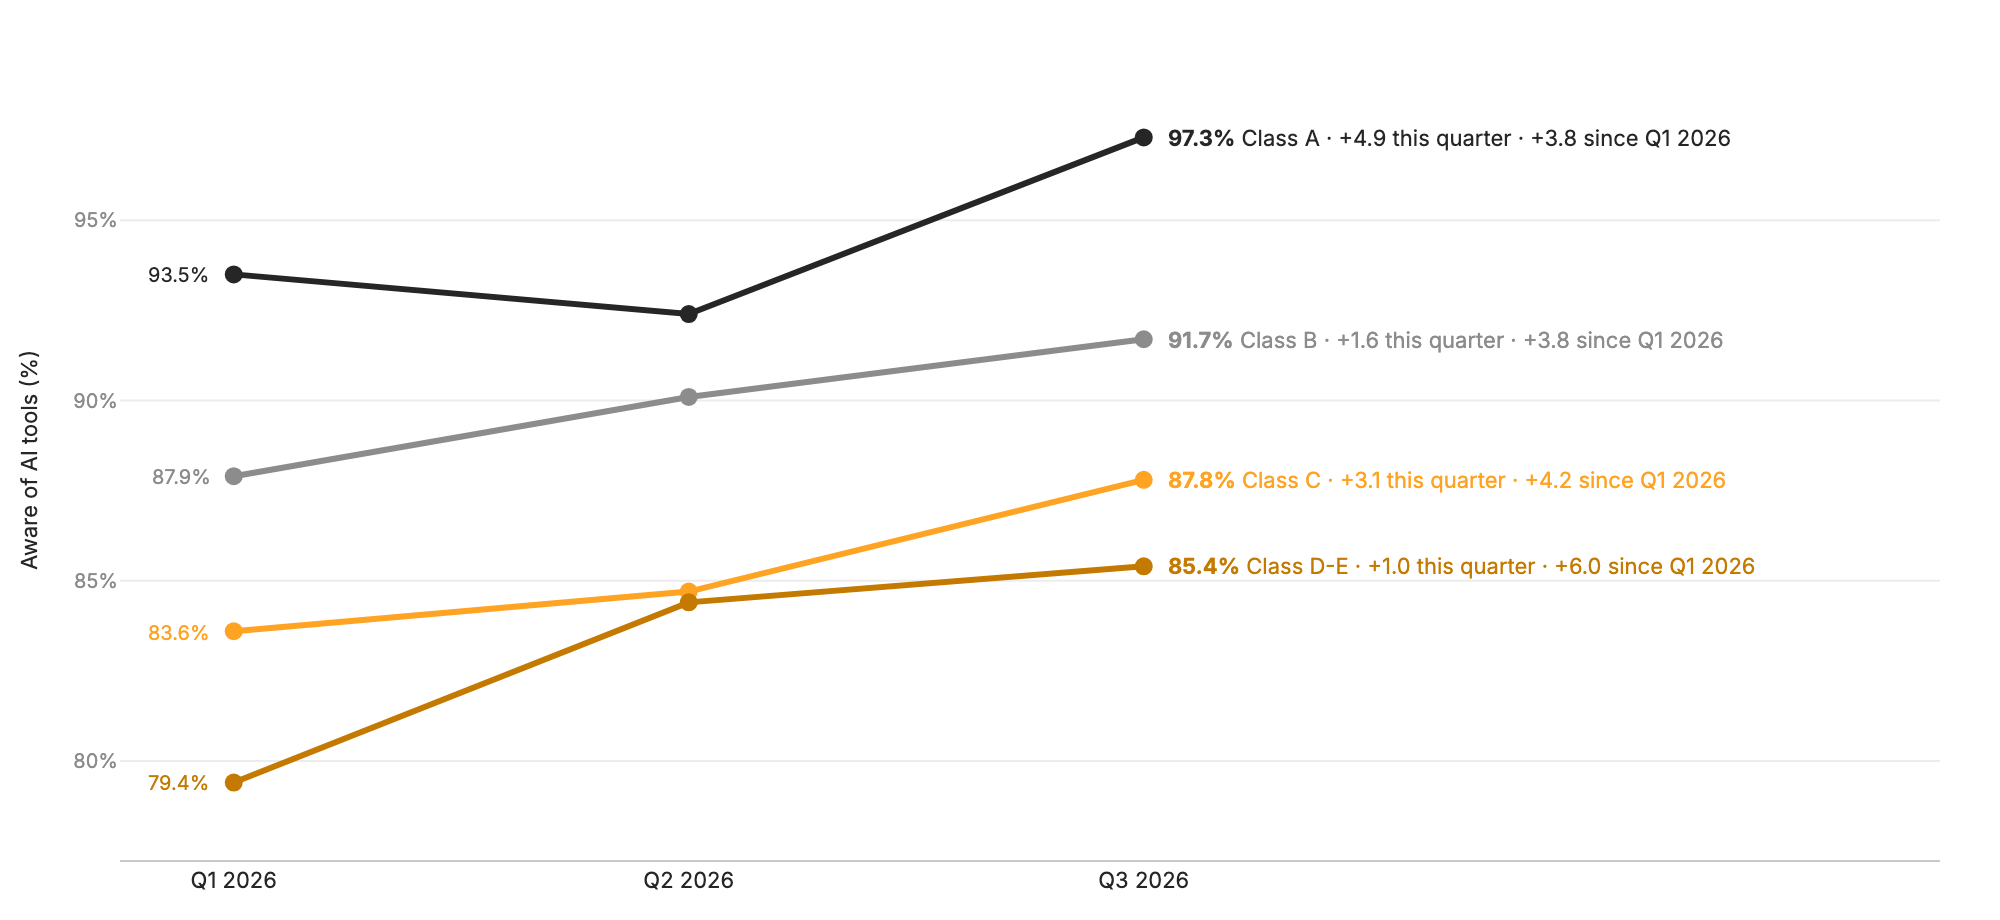
Figure 8 Awareness of AI tools by social class (Q1 to Q3 2026).
Source: Reglab. Note: average % of respondents in each class who report knowing the AI tools assessed. Labels show the Q3 value and the change, in percentage points, over the last quarter and since Q1.
2. Other Highlights of This Edition
This edition confirmed the stability of the Index and brought five highlights. Adolescent protection is the dimension with the lowest trust, and it is also where women and men diverge most. On social media, people trust the content less than the platform itself, a pattern repeated since the start of the series. Artificial intelligence is increasingly well known, but trust in it is not growing at the same pace. It is also in AI that inequality in knowledge of the digital ecosystem is now concentrated: lower-income classes know AI tools less, a much wider class gap in awareness than in any other category. Finally, both those who trust and those who distrust the digital environment tend to keep their position. Two of these results, the one on AI and the one on persistent trust, come from the repeated panel, which follows the same people over time and is explained in the box below.
| How we measure whether trust changed: the repeated panel. Think of a class of students: to know whether they learned, you compare each student’s grade at the end of the course with their own grade at the start, not with the grades of some other class. Opinion works the same way: to know whether trust changed, the ideal is to ask the same people again. That is what the repeated panel allows. In each round, some respondents have already taken part in previous editions. In this edition, 321 of the 1,099 people interviewed (29%) had already answered the Index survey: 250 took part in the Q2 round, and 112 took part in all three rounds. Comparing each person with themselves separates a real change of opinion from a simple change in who was interviewed. It also provides more precision to capture small movements that would otherwise be lost in the natural fluctuation of a new sample. The panel does have limits. On average, its participants are older and include fewer people from classes D-E than the online population. It therefore shows whether these people’s trust changed, but not the level of trust among Brazilians as a whole, which is measured by the full sample. |
2.1. Adolescent Protection: Where Women and Men Diverge
In the overall index, men and women are barely distinguishable (67.6 and 65.5 points). Across dimensions, however, the gap between them is concentrated in adolescent protection: it was 5.4 points in Q1, 5.8 in Q2 and 5.0 now, always statistically significant, compared with no more than 2 points in the other dimensions. Fewer than half of women (48.7%) agree that platforms protect children and adolescents, compared with 55.2% of men. The difference appears in every private-sector category and in every age group, but disappears in Digital Government. This suggests a specific assessment of how private platforms deal with young people, rather than a generalized distrust among women.
Social class adds another layer. The gap between men and women appears both in classes A and B and in classes C and D-E, and the effects of gender and class add up: 59% of men in classes A and B agree that platforms protect young people, compared with 46% of women in classes C and D-E, a difference of 13 percentage points. Combining gender and class, women in classes C and D-E are the only group in which fewer than half agree that platforms protect children and adolescents.
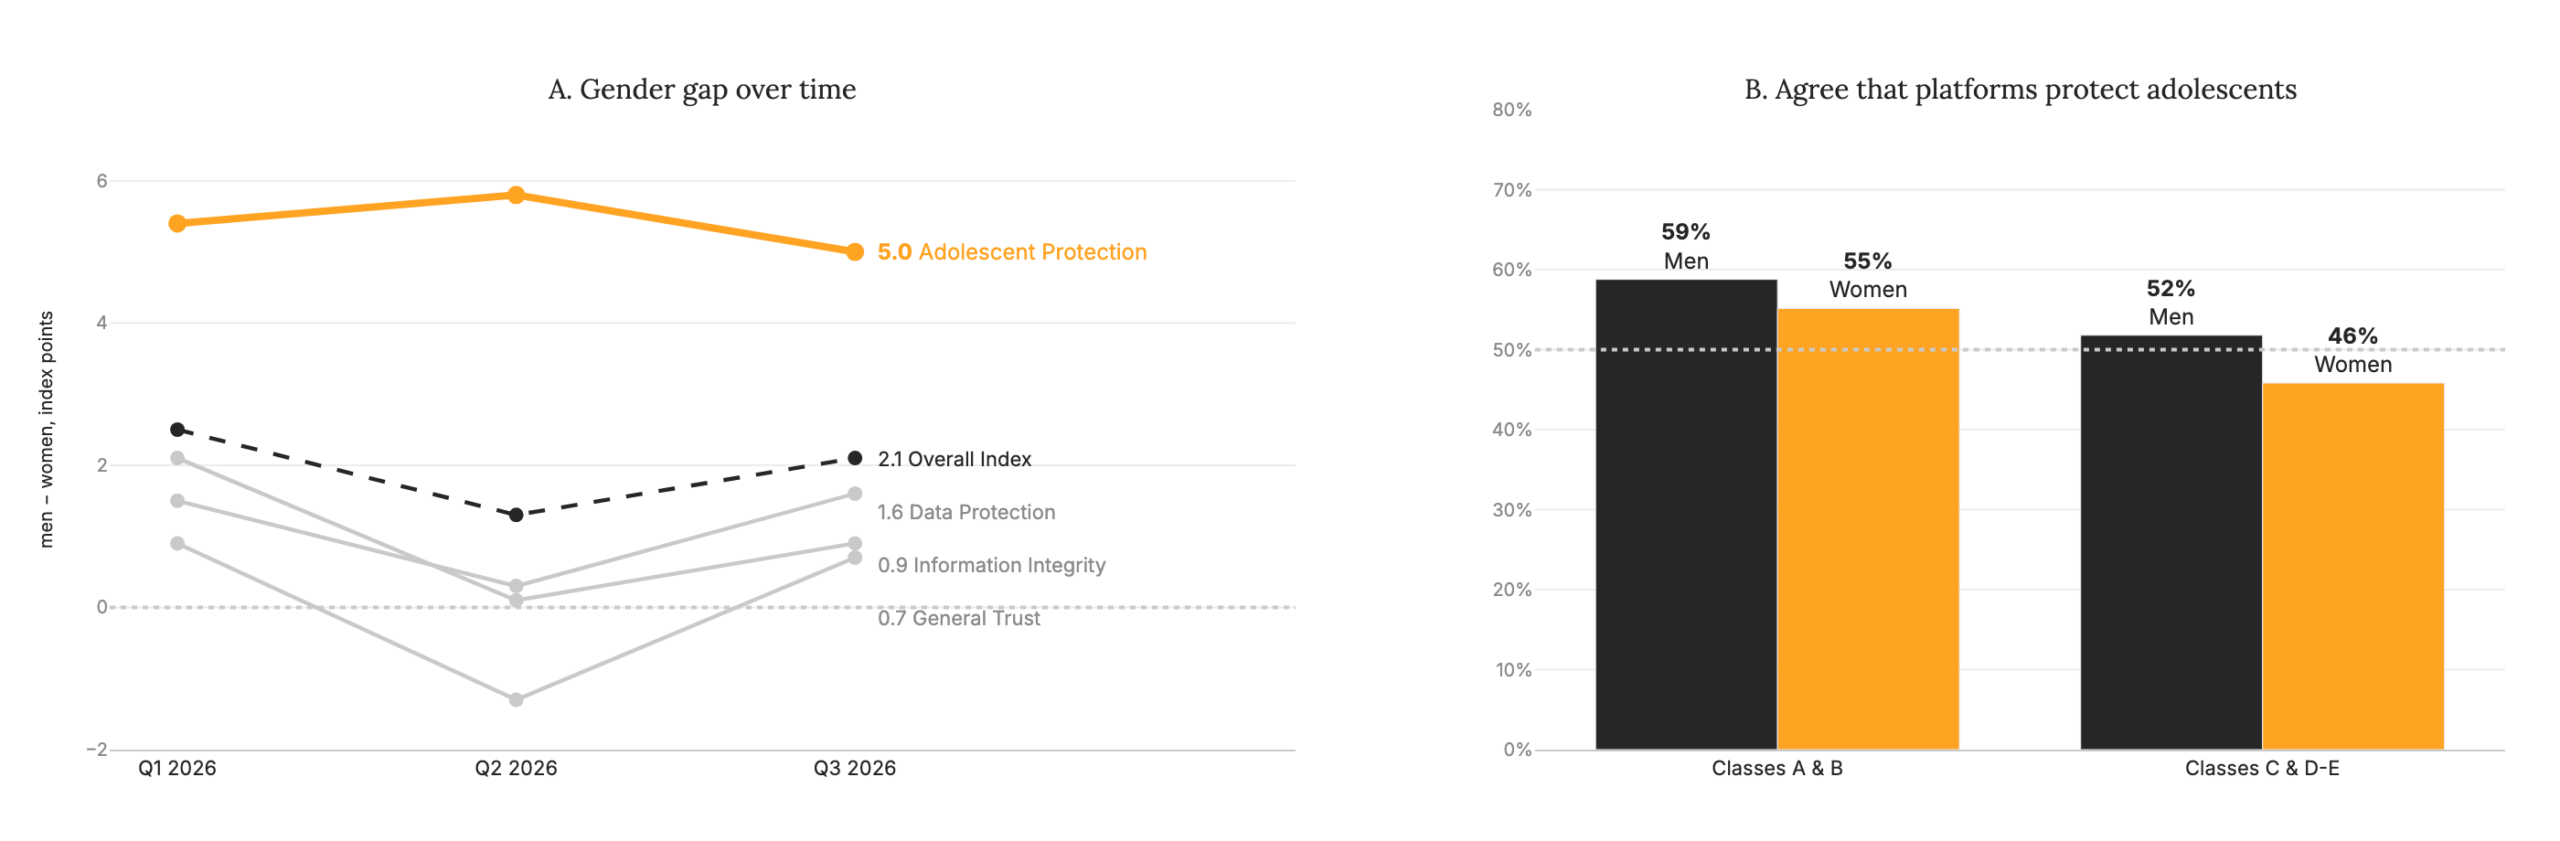
Figure 9 Adolescent protection: where gender and class add up.
Source: Reglab. Note: Panel A: gap between men and women in the overall index and in each dimension, across the three rounds (index points, 0–100 scale; positive values mean men trust more). Panel B: % who agree that platforms protect children and adolescents, by gender and social class, Q3 2026.
2.2. Social Media: People Trust the Platform, but Not the Content
On social media, Brazilians separate the platform from what circulates on it. The Index asks, separately, whether people trust the platform to carry out their activities and whether they consider the content and information they find there trustworthy. On social media, 63% trust the platform, but only 55% trust the content, a difference of 8 percentage points. In the other categories, the two answers practically coincide (73% trust the platform and 72% the content). In other words, on social media, users trust the service but are more distrustful of what they find on it.
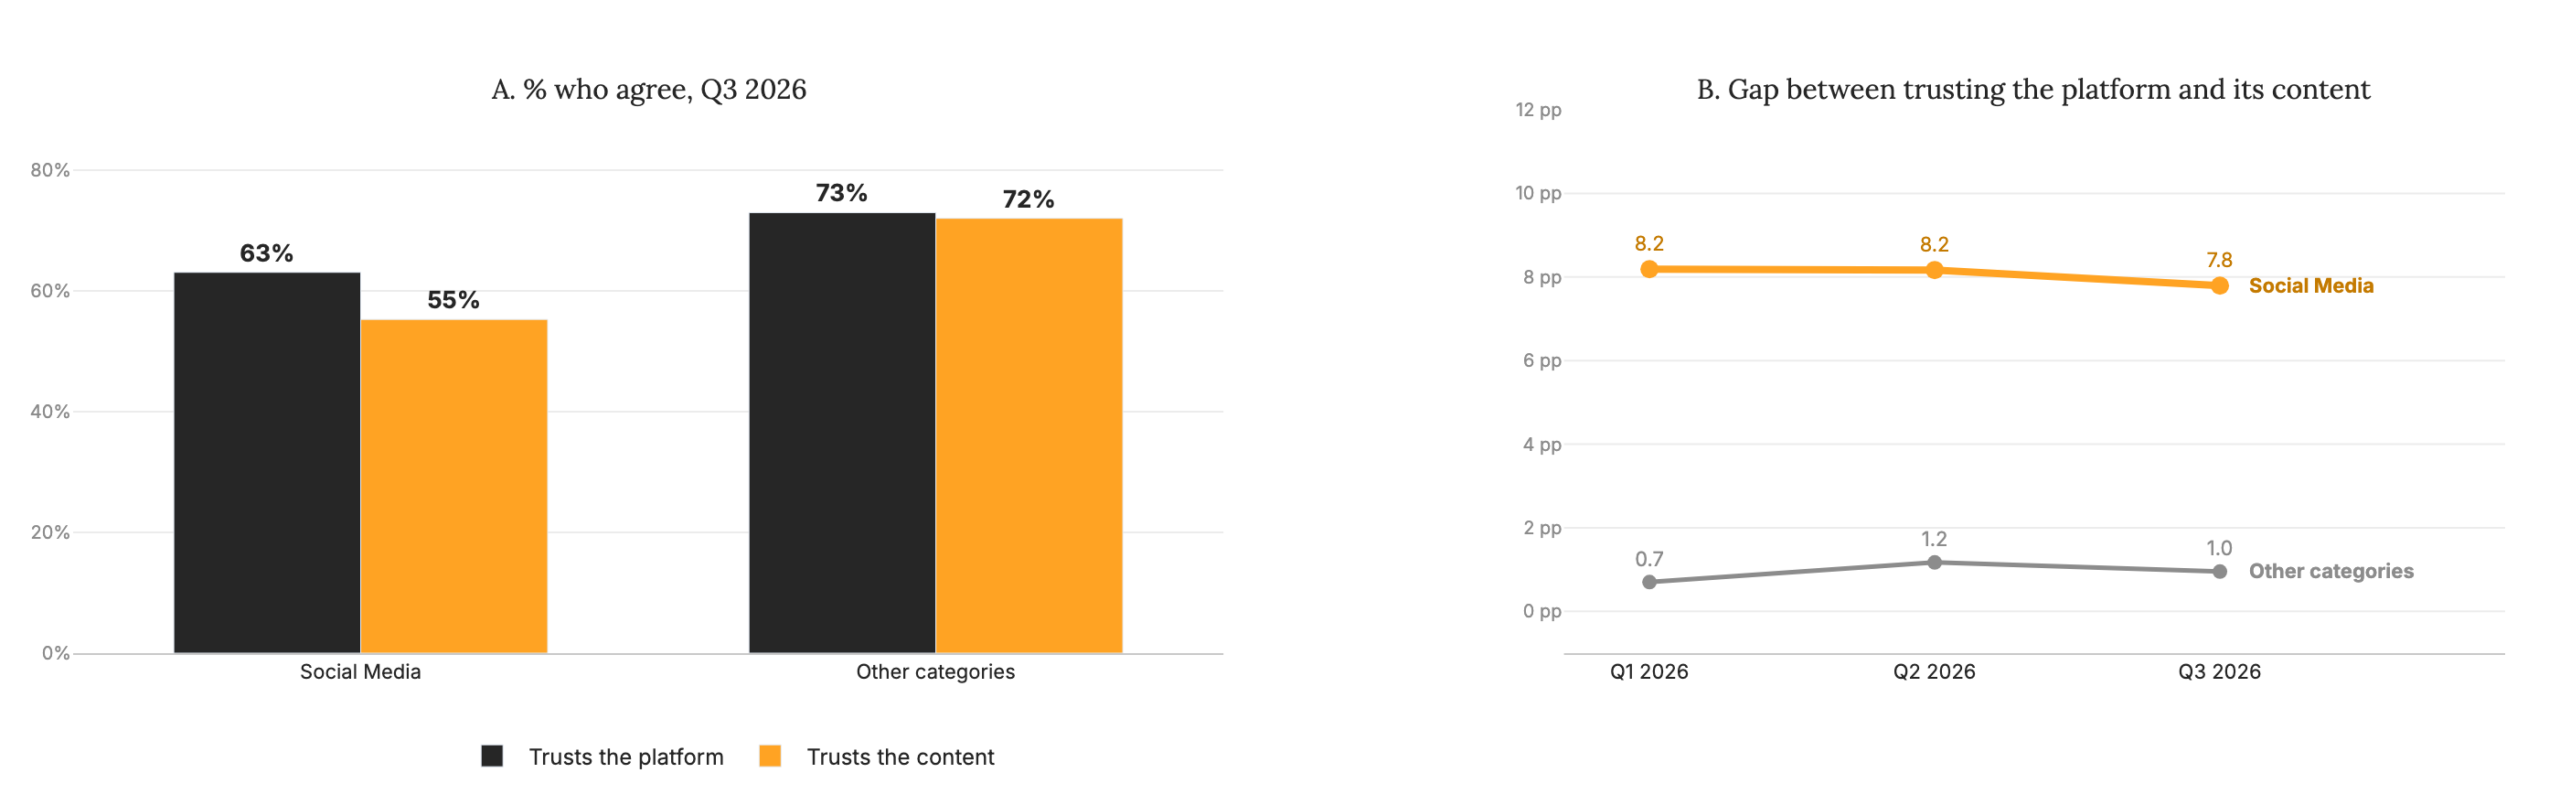
Figure 10 On social media, content inspires less trust than the platform.
Source: Reglab. Note: Panel A: % who agree with each statement, Q3 2026. Panel B: difference between the two percentages across the three rounds, in percentage points. “Other categories” pools the answers for the other four categories.
This gap is not a fluctuation of this edition. It was 8.2 points in Q1 2026, 8.2 in Q2 and 7.8 now, while in the other categories it has always been close to 1 point. Everything indicates that it is a structural feature of how people perceive social media, not a short-term effect.
2.3. Artificial Intelligence: Knowing Is Not Trusting
Artificial intelligence becomes better known in every round, but trust does not seem to be growing at the same pace. The repeated panel indicates that the rise in trust in AI highlighted in our Q2 analysis has lost strength. Among people who took part in all three rounds, trust in AI went from 1.00 to 1.074 in Q2 and fell back to 1.020 now. Over the same period, the overall index for these same people changed little (1.017 and 1.010). The decline appears across age, class and gender groups, but because these subgroups are small, the movement should be read as a signal to watch.
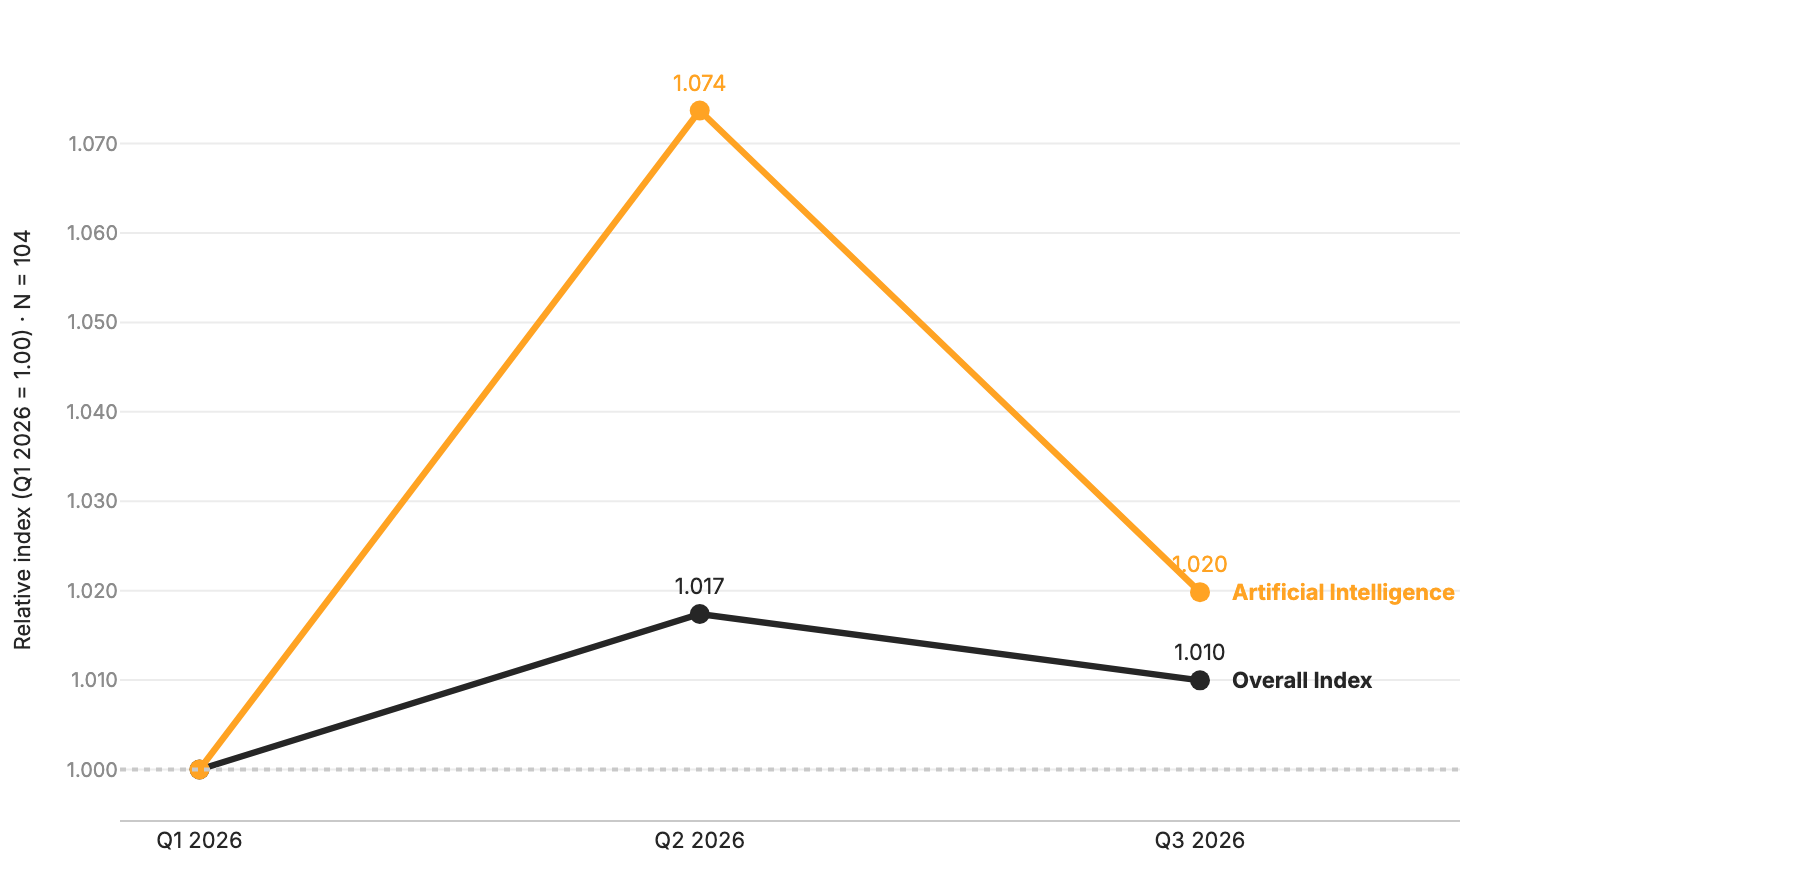
Figure 11 The rise in trust in AI lost strength, while the overall index remained stable.
Source: Reglab. Note: trust in artificial intelligence and overall index among the same respondents across the three rounds (Q1 2026 = 1.00). N = 104: of the 112 people who answered all three rounds, 8 did not rate any AI tool in at least one of them (they answered “I don’t know this platform” or “I don’t know”) and are excluded from the comparison.
The panel also shows that knowing is not enough. When a person becomes aware of a new AI tool, they assess it more cautiously than the tools they already knew. Among respondents followed since Q2, the newly known tool received an average of 51.0 points, compared with 60.5 for the tools the same person already knew. The group is small (28 people), and the newly known tools are mostly the less widespread ones. Even so, the difference holds when comparing the same tool: those who have just become aware of it trust it less than those who already knew it. Trust, therefore, does not arrive together with awareness: it seems to form over time, possibly as people start using these tools.
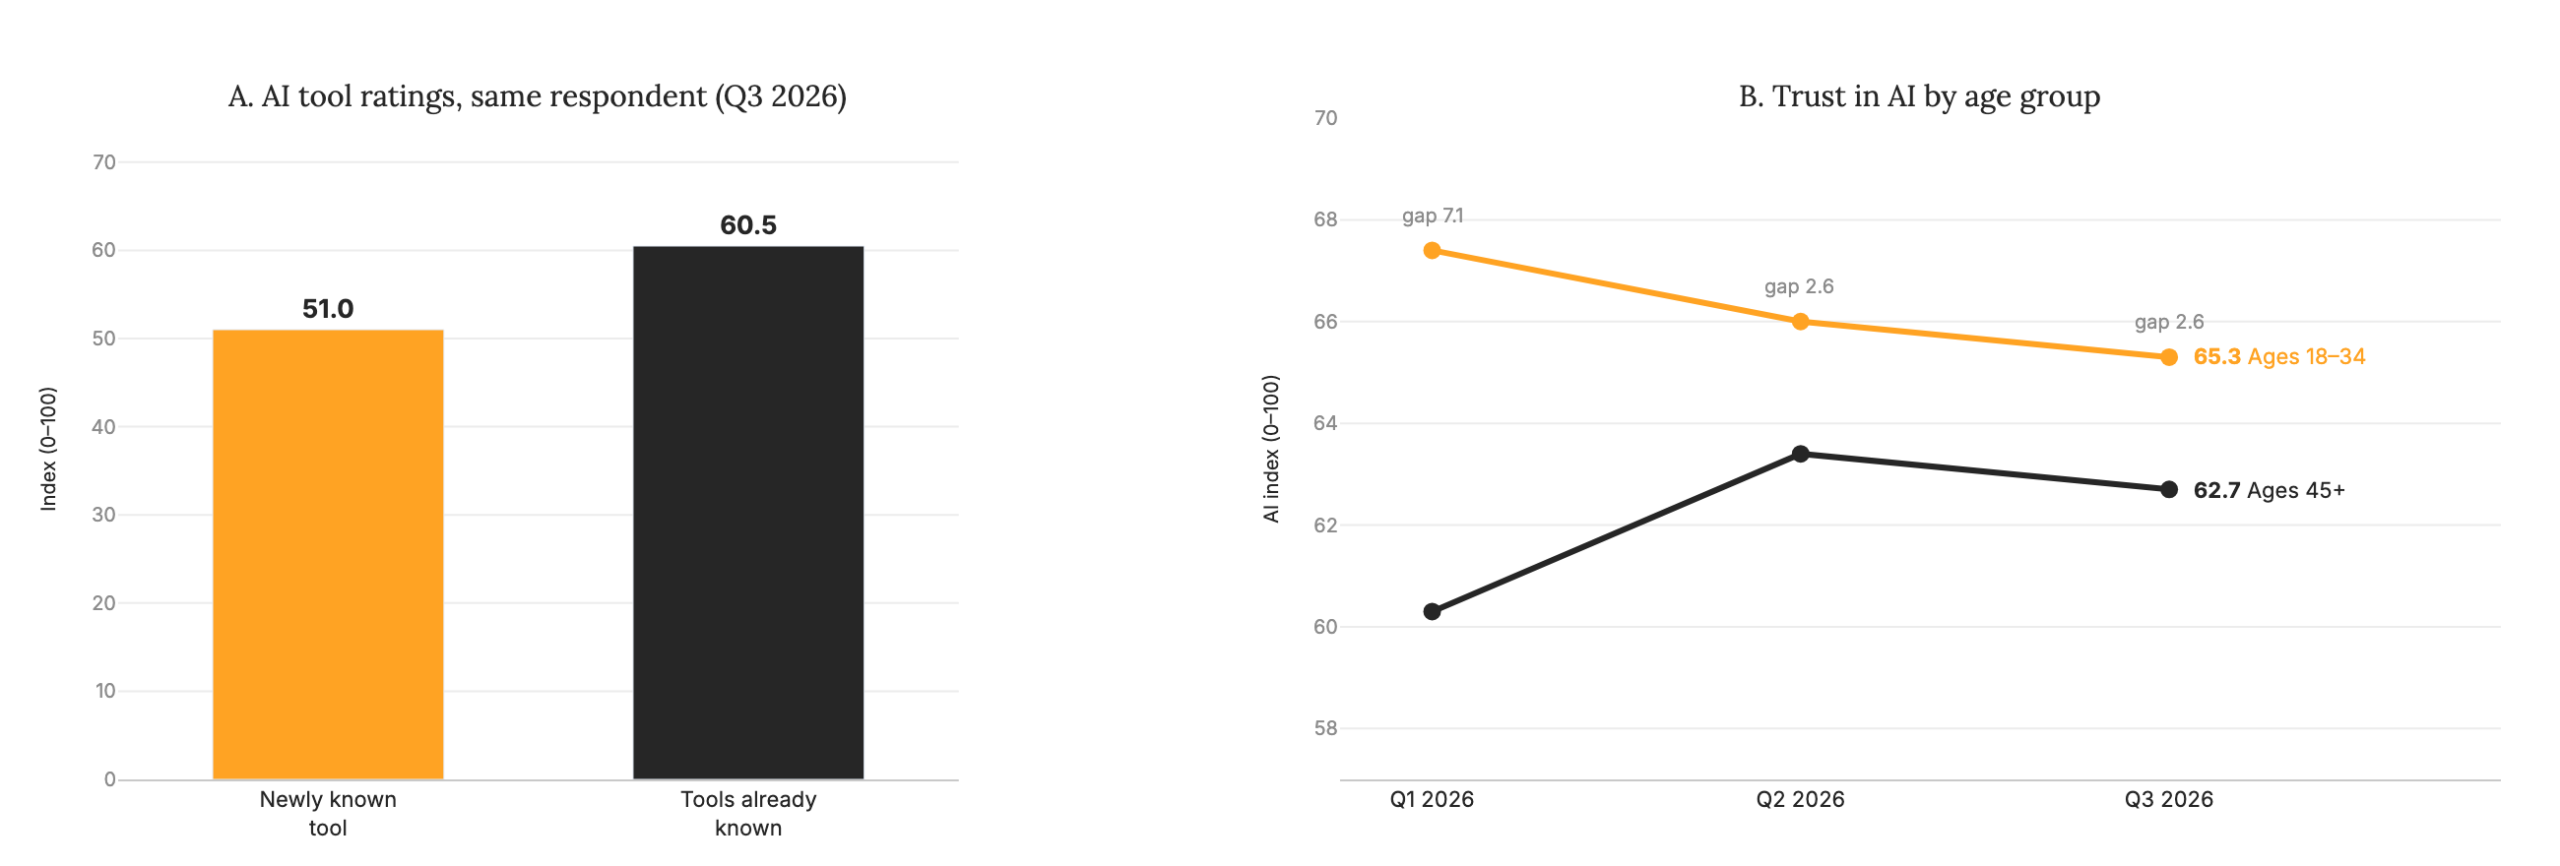
Figure 12 Knowing is not trusting, and the generational gap is narrowing.
Source: Reglab. Note: Panel A: average rating of AI tools, depending on whether the tool had just become known or was already known to the same person, Q3 2026; 28 repeated-panel respondents who became aware of at least one AI tool between Q2 and Q3. Panel B: trust in AI by age group across the three rounds (0–100 scale).
There is also a signal to watch in the relationship between age and AI. In Q1 2026, Brazilians aged 18 to 34 trusted artificial intelligence 7.1 points more than those aged 45 and over. In Q2, the gap fell to 2.6 points, and in this edition it remained at 2.6. The convergence came from both sides: older people came to trust AI a little more, and younger people a little less. Young people remain ahead, and the reduction is still within the margin of error. If the movement is confirmed, however, trust in AI will tend to stop being a generational marker.
In Q2, we put forward two readings for the rise in trust in AI: the fact that the technology is in an adoption phase, and the advertising campaigns for ChatGPT and Gemini during the World Cup. The decline in this edition, observed across different groups, is more consistent with the second: an exposure effect that faded after the campaign. The data, however, do not allow this cause to be isolated.
2.4. Digital Inequality: The Gap Is Now in AI
Platform awareness increased in this edition. The share of online Brazilians who know all 26 platforms assessed went from 63.3% in Q2 to 69.2% now, a statistically significant increase that holds when the sample is adjusted to the composition of previous rounds. The gain was driven by the less well-known tools, especially AI tools, and reached all classes, but it did not narrow the gap between them: in class A, 83.6% know the whole ecosystem, compared with 62.8% in classes D-E.
This gap, however, is not evenly distributed across categories. In Streaming and Digital Government, classes A and D-E know the platforms in practically the same proportion (differences of 1.7 and 2.6 percentage points). In Social Media and the Platform Economy, the gap is slightly larger (4.8 and 6.0 points). It is in artificial intelligence that lower-income classes fall furthest behind: the difference between classes A and D-E in awareness of AI tools was 14.1 points in Q1, fell to 8.0 in Q2 and widened again to 11.9 now, almost twice the second-largest gap (Figure 13, panel B). The difference is concentrated in the less widespread tools, Claude and Perplexity, known by 72% and 75% of classes D-E, about 20 points below class A.
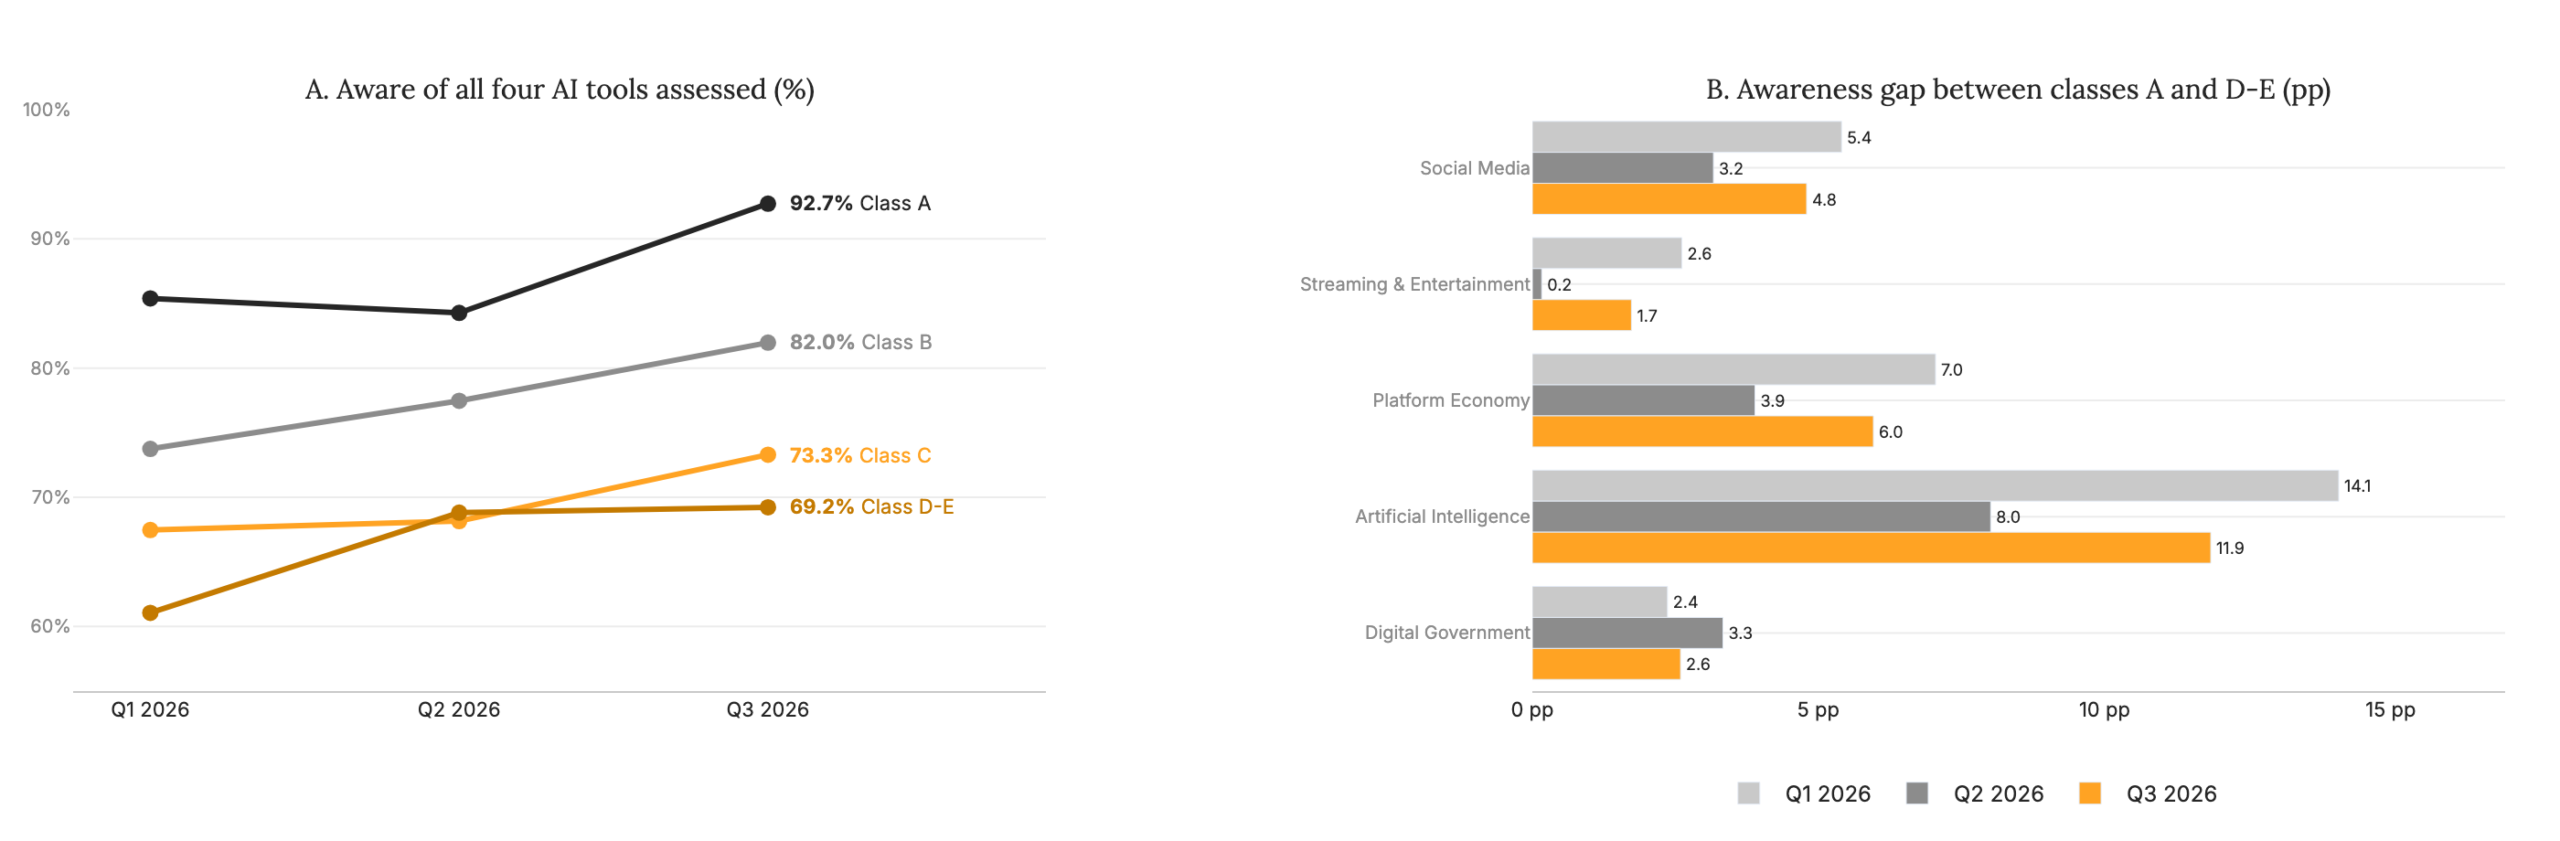
Figure 13 The class gap in awareness is now in AI.
Source: Reglab. Note: Panel A: % of respondents who know all four AI tools assessed, by social class, across the three rounds. Panel B: difference, in percentage points, between classes A and D-E in the average % of respondents who report knowing the platforms in each category, across the three rounds.
This edition’s movement sharpens the contrast. Class A has practically completed its AI repertoire: 92.7% know all four tools assessed, compared with 84.3% in Q2 (Figure 13, panel A). In classes D-E, the share stalled (68.8% in Q2 and 69.2% now), after the gain recorded in the previous edition. In practice, almost a third of online people in classes D-E still do not know all the AI tools assessed.
2.5. Persistent Trust: Those Who Trust and Those Who Distrust Tend to Keep Their Position
Because the repeated panel interviews the same people in each round, it allows us to answer a simple question: do those who distrusted the digital environment in Q2 still distrust it now, and do those who trusted it still trust it? To find out, we split the people followed into three groups of equal size according to their level of trust in Q2 (the least trusting, the middle group and the most trusting) and checked which group each person was in during this edition.
The answer is yes, especially at the extremes. Of every 100 people who were least trusting in Q2, 77 remain in that group, 18 moved to the middle group and only 5 jumped to the most trusting group. Among the most trusting, 70 of every 100 remain at the top, 23 moved to the middle group and only 7 fell to the least trusting group. The middle group is the one that moves most: just over half remain in the middle, and the rest split between the two sides.
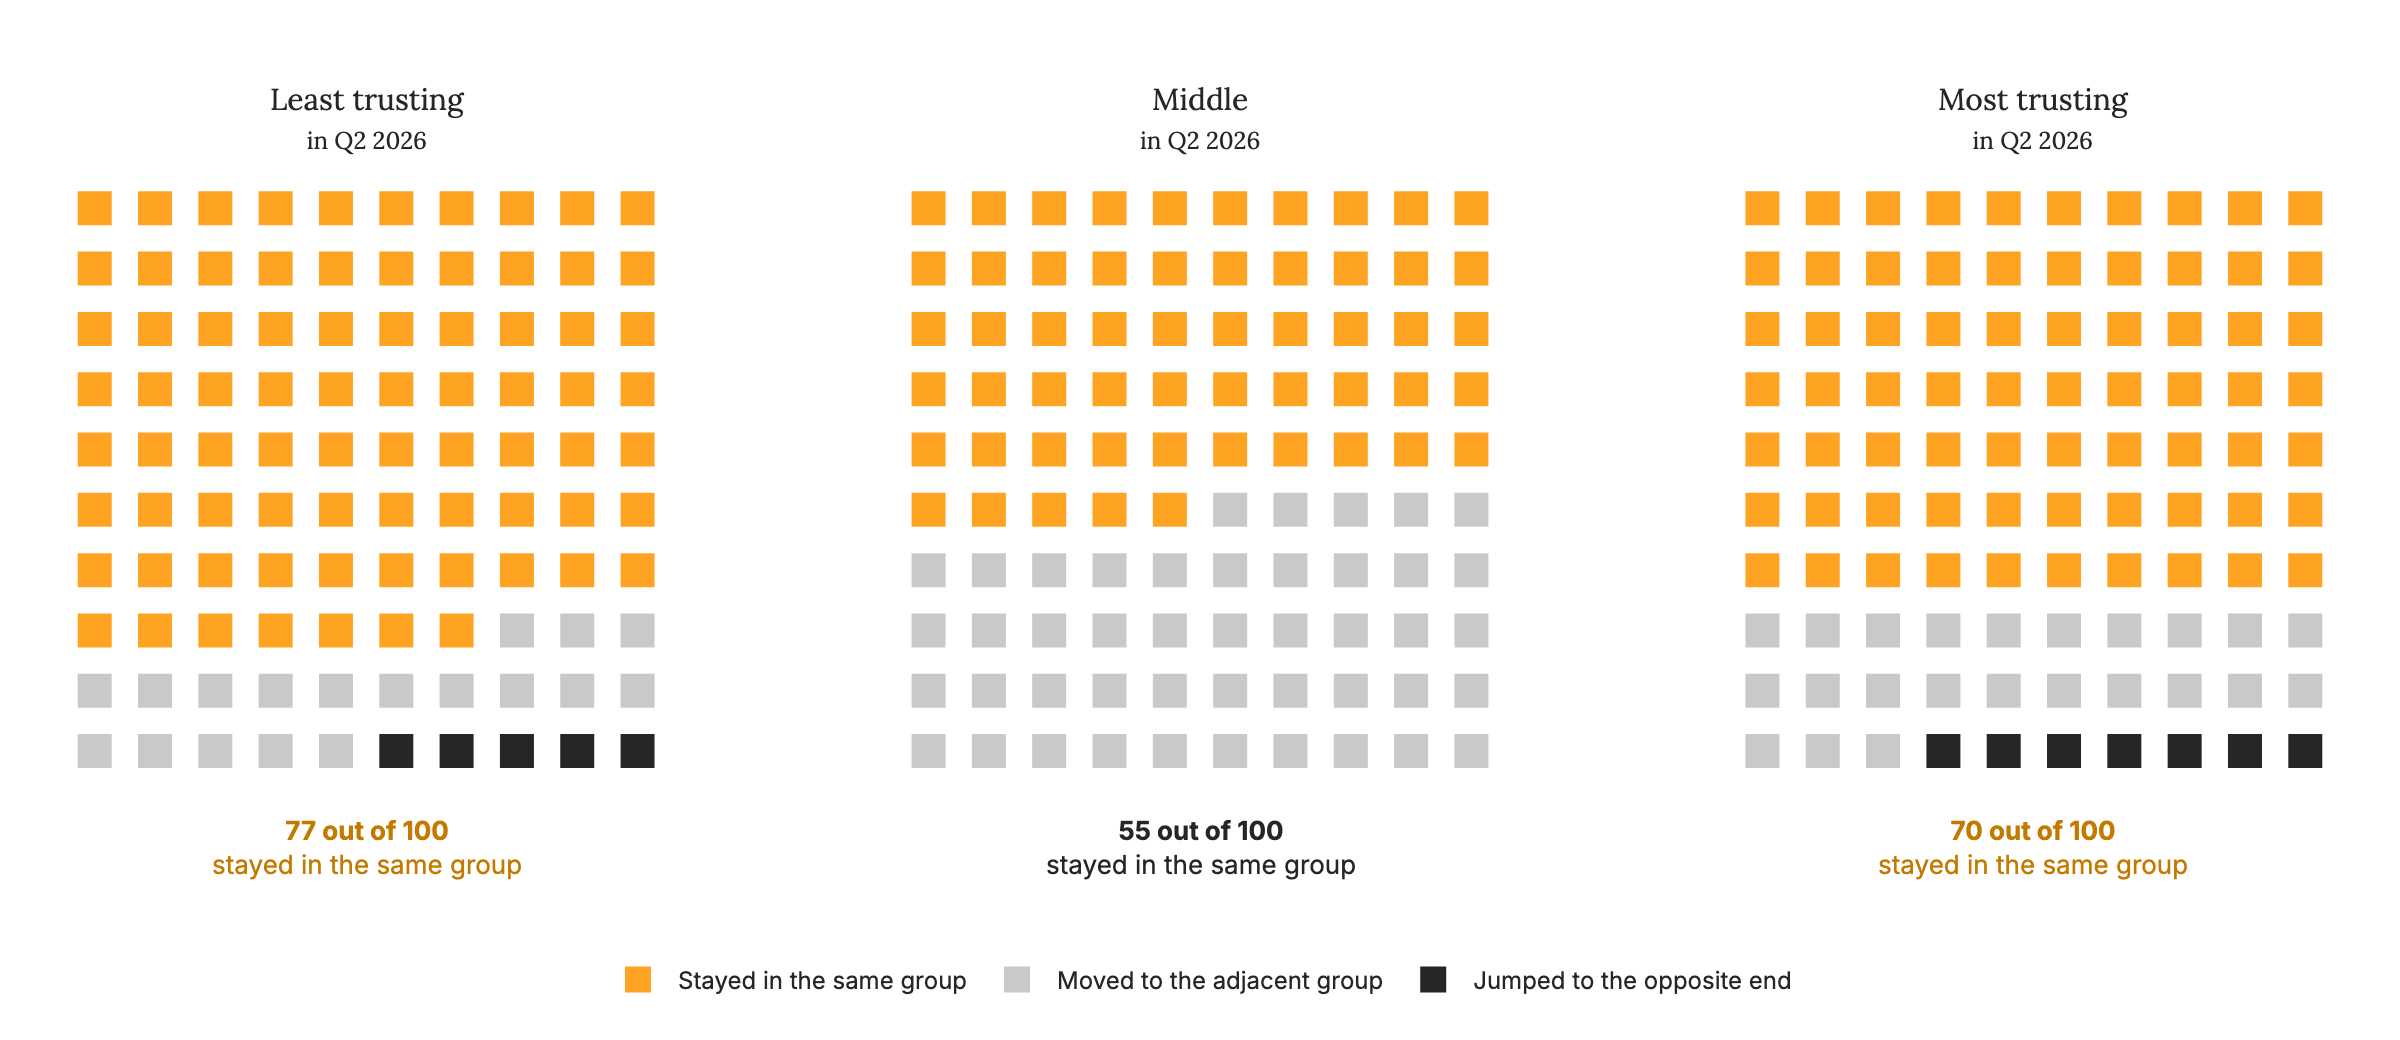
Figure 14 Persistent trust: where the people in each Q2 trust group are in Q3.
Source: Reglab. Note: each square represents 1 in every 100 people in the group. In orange, those who stayed in the same group; in gray, those who moved to the adjacent group; in black, those who jumped to the opposite group. N = 249: of the 250 people who answered both rounds, one did not rate any platform in one of them (they answered “I don’t know this platform” or “I don’t know” to all) and is excluded from the comparison.
Each person’s ratings vary somewhat from one round to the next, but their relative position tends to hold: those who were among the least trusting tend to stay there, and the same is true for the most trusting. At least over the period observed, trust in the digital environment looks more like a stable characteristic of each person than an opinion that changes with the moment.
| This section analyzes the survey results, relating them to academic literature and expert opinion, through the authors' lenses. |
The first result to interpret is stability itself. The Index stood practically still for the third time, now in a period marked by the election campaign and the first round of voting. As we noted in Q2, public exposure can make a topic more visible without changing, at the same pace, how people assess it (McCombs and Shaw, 1972). The repeated panel reinforces this reading with new evidence: those who distrusted the digital environment tend to keep distrusting it, just as those who trusted it tend to keep trusting it. The literature on trust helps explain the pattern by treating it as a relatively stable disposition, formed over time and not very sensitive to isolated events (Uslaner, 2002). For policymakers and for those who communicate with users, this means that campaigns and one-off episodes tend to do little to move trust, which is built, and lost, slowly.
Aggregate stability, however, does not mean uniformity. Within this stable picture, distrust is concentrated in specific places, and social media is the clearest case. On social media, users trust the platforms and the services they offer, but are more distrustful of the content that circulates on them, a gap that held across all three rounds. The perceived problem is not how the platform works but the quality of information, and this is precisely the dimension at the center of the Brazilian regulatory debate since the Federal Supreme Court ruled, in June 2025, that Article 19 of the Brazilian Civil Rights Framework for the Internet (Marco Civil da Internet) was partially unconstitutional, expanding platforms’ liability for third-party content. The Index data suggest that the trust social networks have accumulated as a service does not automatically carry over to what is published on them, and that it is in the perception of content that moderation and transparency rules have the most to show users.
The distance between trusting the platform and trusting the content can be read through two factors that are not mutually exclusive. The first is a broader feature of Brazilian society. Brazil is among the countries with the lowest interpersonal trust in the world: in the World Values Survey comparison reproduced by Nunes (2025), only 6.5% of Brazilians agree that “most people can be trusted,” below Mexico (10.5%) and the United States (37%) and far from Norway (72.1%). In Nunes’s words, Brazilians “trust a few people a great deal; for those outside this small circle, what remains is distrust.” This backdrop helps put the result in context, but does not explain it on its own. The second factor concerns the type of content that circulates on social media. Unlike catalogue-based platforms and other services, information there is published without prior editorial curation, comes from sources of very uneven quality and is distributed by systems that tend to favor what generates engagement. Lower trust in content may reflect both distrust of those who publish and an assessment of the nature of what circulates on social media. This is consistent with trusting the platform as a service without trusting what one finds on it.
The round was in the field from October 2 to 9, a period that included the first round of the elections, on October 4. The Index was not designed to measure the effect of the election campaign, since the sample changes from one round to the next and other events in the period may also have influenced perceptions. It is therefore not possible to attribute the observed variations to the elections, nor to state that the elections had no influence. The results of this edition, including those on information integrity on social media, should be read as a snapshot of trust during the fieldwork period, not as a measure of electoral impact.
If on social media trust is already formed and divided, in artificial intelligence it is still under construction. AI keeps gaining awareness in every round, but trust has not kept up: the Q2 gain faded among the same people, and those who have just become aware of a tool assess it cautiously. The pattern is consistent with the literature on the diffusion of innovations, which treats knowing, forming an opinion and adopting as distinct stages (Rogers, 2003), and with the idea of calibrated trust in automated technologies, according to which appropriate trust depends on people observing, through use, what the technology actually delivers (Lee and See, 2004). Advertising exposure can raise trust for a short period, but sustaining it depends on experience.
That experience, however, is not reaching everyone in the same way. Platform awareness rose in all classes, to the point that seven in ten online Brazilians already know all the platforms assessed, but in AI tools lower-income classes have fallen behind, and knowing more does not translate into trusting more. The literature calls this shift the second-level digital divide: once access becomes universal, inequality shows up in knowledge, skills and use (Hargittai, 2002; van Deursen and van Dijk, 2014). The Index shows this movement happening now with AI, which indicates that digital inclusion policies limited to connectivity are unlikely to reach this new frontier, and that AI literacy, especially for classes D-E, becomes part of the agenda.
Women and lower-income classes appear again when looking at the most sensitive dimension of the Index: adolescent protection. It remains the only dimension below its Q1 level, and it is also the one that most separates social groups, especially by gender. In this edition, 48.7% of women agree that platforms protect children and adolescents, compared with 55.2% of men; in class A the figure is 65.3%, and in classes D-E, 47.1%. The literature on risk perception shows that women tend to assess risks more cautiously (Gustafson, 1998), and in Brazil it is women who carry most of the care work (IBGE, 2023), which places them closer to the online lives of children and dependents. Roughly six months after the Digital Statute of Children and Adolescents (ECA Digital) came into force, this perception has not improved. The policy feedback literature helps explain why: a policy only changes how people perceive a problem when its effects become visible and attributable to it in everyday life (Pierson, 1993; Mettler, 2011). The effect of the ECA Digital on trust, if it comes, will depend less on the law’s approval and more on whether its implementation is noticed by those who follow young people’s use of platforms, largely women.
References
BRASIL. Lei nº 12.965, de 23 de abril de 2014. Estabelece princípios, garantias, direitos e deveres para o uso da Internet no Brasil (Marco Civil da Internet). Diário Oficial da União, Brasília, DF, 24 abr. 2014.
BRASIL. Lei nº 15.211, de 17 de setembro de 2025. Dispõe sobre a proteção de crianças e adolescentes em ambientes digitais (ECA Digital). Diário Oficial da União, Brasília, DF, 2025.
BRASIL. Supremo Tribunal Federal. Recurso Extraordinário 1.037.396 (Tema 987) e Recurso Extraordinário 1.057.258 (Tema 533). Julgamento em 26 jun. 2025.
GUSTAFSON, P. E. Gender differences in risk perception: theoretical and methodological perspectives. Risk Analysis, v. 18, n. 6, p. 805-811, 1998.
HARGITTAI, E. Second-level digital divide: differences in people's online skills. First Monday, v. 7, n. 4, 2002.
IBGE. Pesquisa Nacional por Amostra de Domicílios Contínua: outras formas de trabalho 2022. Rio de Janeiro: IBGE, 2023.
LEE, J. D.; SEE, K. A. Trust in automation: designing for appropriate reliance. Human Factors, v. 46, n. 1, p. 50-80, 2004.
McCOMBS, M. E.; SHAW, D. L. The agenda-setting function of mass media. Public Opinion Quarterly, v. 36, n. 2, p. 176-187, 1972.
METTLER, S. The submerged state: how invisible government policies undermine American democracy. Chicago: University of Chicago Press, 2011.
NUNES, F. Brasil no espelho: um guia para entender o Brasil e os brasileiros. Rio de Janeiro: Globo Livros, 2025.
PIERSON, P. When effect becomes cause: policy feedback and political change. World Politics, v. 45, n. 4, p. 595-628, 1993.
ROGERS, E. M. Diffusion of innovations. 5. ed. New York: Free Press, 2003.
USLANER, E. M. The moral foundations of trust. Cambridge: Cambridge University Press, 2002.
VAN DEURSEN, A. J. A. M.; VAN DIJK, J. A. G. M. The digital divide shifts to differences in usage. New Media & Society, v. 16, n. 3, p. 507-526, 2014.
Methodology Annex
About Reglab
Reglab is a private research center that produces studies and strategic consulting for companies, associations and policymakers operating in technology, media and regulated markets. We are obsessed with data, rigorous methods and translating evidence into practical, actionable language. Learn more at www.reglab.com.br.
Acknowledgements
Executive Director: Pedro Henrique Ramos
Research Director: Marina Garrote
Head of the Applied Economics Unit: João Ricardo Costa Filho
Authors: Thais Palanca da Silva, Pedro Henrique Ramos, and Marina Garrote
Researchers: Thais Palanca da Silva, Taís Fonseca da Rocha, Isadora Cristina Gonçalves.
Final Layout: Larissa Camargo
| Suggested citation: PALANCA, T.; RAMOS, P. H.; GARROTE, M. Reglab Trust & Safety Index: Edition 2 – Q3 2026. São Paulo: Reglab, 2026. |
Research Question
How do adult Brazilian internet users perceive trust and safety on the main digital platforms that are part of their daily lives, considering different service categories and four specific assessment dimensions? How did this perception evolve across the first, second and third quarters of 2026, and how is it distributed by category, dimension and sociodemographic profile?
Methodology Summary
Quantitative research based on a structured national survey, using a five-point Likert scale converted into a composite Trust & Safety index (0–100), applied to 26 digital platforms in five categories. Report 2 is the second round of comparison with the Q1 survey (Baseline Survey). Results by category, subcategory, dimension and platform are presented in normalized form (Q1 2026 = 1.00), and a repeated-panel subsample makes it possible to measure changes of opinion among the same people over two and three rounds.
Data Collection
Data were collected through a national online panel run by Norstat, a company specializing in digital research and opinion studies, with a 95% confidence level and a margin of error of ±3 percentage points. Quotas were set by age group, social class, geographic region and gender. Norstat operates a proprietary panel, recruited and managed entirely in-house. Participation is voluntary and subject to acceptance of the Terms of Use and Privacy Policy. Respondents receive incentives for each completed survey, which tends to increase engagement and response quality. To ensure that each respondent is a real and unique person, multiple layers of control are used, including reCAPTCHA at sign-up and login to prevent automated access, and IP validation and geographic consistency checks (GEO IP), with permanent deactivation of accounts when inconsistencies are confirmed. Responses were recorded on a five-point Likert scale, from “strongly disagree” to “strongly agree,” with two additional non-substantive response options: “I don’t know” and “I don’t know this platform.” These responses were treated as missing information and excluded from the index calculation for that specific platform.
Data Analysis
The analysis used descriptive statistics, the construction of a composite indicator and tests of differences between rounds. Each Likert response was converted to a numeric value from 1 to 5 and then transformed to a standardized 0–100 scale. The index for each unit of analysis (the overall index, a category, a dimension, a platform or a sociodemographic group) is the average of all valid responses that make up that unit. Platforms are not weighted by audience, market share or revenue. Because “I don’t know” and “I don’t know this platform” responses are excluded, however, platforms rated by more people contribute more responses to the average.
To preserve consistency across rounds and avoid misreadings, results are presented in two complementary ways, depending on the nature of each breakdown. The overall index and demographic breakdowns (social class, age group, gender and region) are shown in absolute values on the 0–100 scale. In these cases, the level of trust is directly interpretable and it makes sense to compare groups with one another, because they all measure the same thing, people’s trust, in subsets of the same population. Categories, subcategories, dimensions and platforms are shown as relative changes, with each unit’s Q1 2026 value set to 1.00. What is reported in these cases is how much each unit moved, not its absolute level. The choice is deliberate: units of very different natures, such as a social network and a government service, are not comparable in level, and the index is not meant to say that one type of platform is “worth more” than another. Normalization avoids this comparison, keeps the focus on each unit’s trajectory and ensures that future rounds are always read against the same starting point. Platform awareness, that is, the share of respondents who know each platform, is presented as a percentage.
In addition to the cross-section, which compares the full samples of each round, made up mostly of different people, Report 2 includes a repeated panel. Of the 1,099 respondents in this edition, 321 (29%) had taken part in a previous round: 250 in Report 1, 183 in the Q1 survey (Baseline Survey) and 112 in all three rounds. Because it follows the same people over time, the panel makes it possible to distinguish a real change of opinion from a simple change in the composition of who was interviewed. In this edition, it was used to measure the paired change in the index between Report 1 and Report 2, whether each person stayed in their trust group (dividing the panel into three groups of equal size), how newly known AI tools were rated compared with tools the same person already knew, and the trajectory across three rounds. Two-round comparisons use the 249 people with a computable index in both rounds, and the three-round trajectory uses the 104 with AI ratings in all three. Because it is a subsample that is not representative of the population, the panel measures change, not levels.
Differences between rounds and between groups were assessed with statistical tests: Welch’s t-test for independent samples, a paired t-test for the panel and a z-test for proportions, with a Bonferroni correction in blocks with many simultaneous comparisons. Statistically significant variations are treated as real change. The rest are treated as “signals to watch.” As a robustness check, the overall index was recalculated with the sample reweighted to the demographic composition of previous rounds (66.5 unadjusted and 66.0 adjusted), and the conclusion of stability held.
Bias-reduction Procedures
Established theoretical and methodological references: the structure of the index was based on recognized literature on measuring trust in digital environments and on building composite indicators.
Standardized instrument: all platforms were assessed using statements written in simple language and with a similar structure, with minimal adaptations by category, reducing artificial variations in interpretation.
Exclusion of non-substantive opinions: “I don’t know” and “I don’t know this platform” responses were excluded from each platform’s calculation, avoiding distortion of the average by respondents without enough familiarity to give an opinion.
Comparability controls: the index was designed to avoid inappropriate comparisons between different categories, preserve internal normalization by category and prevent differences in the nature of services from contaminating the analysis.
Double validation of interpretive steps: a cross-validation process was adopted for the data analysis steps. At least two researchers reviewed the text and the inferences drawn.
Methodological transparency: analytical decisions have been made explicit since the Baseline edition, including the conversion formula, aggregation criteria, the absence of weighting and caveats on interpretive limits, in line with Reglab’s replicability standards.
Methodological consistency across rounds: the same instrument, the same coding scheme and the same index formula were applied to all three rounds, and normalization used the same starting point (Q1 2026 = 1.00). When a technical change to the instrument compromised comparability, as in the first fieldwork attempt of Q3, that data collection was discarded and repeated.
Separating real change from compositional change: because most of the sample is made up of different people in each round, an aggregate change may simply reflect who was interviewed rather than a change of opinion. The repeated panel (250 people between Report 1 and Report 2, and 112 across all three rounds) makes it possible to distinguish between the two. Reweighting the full sample to the composition of previous rounds serves the same purpose in the cross-section.
Significance threshold and caution with subgroups: only statistically significant variations within the specific breakdown were treated as real change, and the margin of error is larger the smaller the group. Below that threshold, results were classified as “signals to watch.” In blocks with many simultaneous comparisons, a correction for multiple comparisons was applied, and small-N breakdowns, including panel subgroups, were read as indicative rather than conclusive.
Other methodological limitations
Perception, not behavior: the Index measures what people believe and feel about platforms, not what actually happens to their data or experiences. A platform may have high technical security standards and still receive a low score, or vice versa.
Equal weights across dimensions and platforms: no dimension or platform receives additional weight for importance, audience or market size. Because the index is the average of valid responses, platforms known by more people contribute more responses. Alternative weightings could produce slightly different results.
Exclusion due to unfamiliarity: less well-known platforms are rated by a smaller subset of the sample, which may introduce selection bias.
Timing and context of data collection: the results reflect the moment when the survey was carried out. This round was in the field from October 2 to 9, 2026, a period that included the first round of the elections, on October 4. The Index was not designed to measure the effect of the election campaign: the sample changes from one round to the next, and other events in the period may also have influenced perceptions. It is therefore not possible to attribute the observed variations to the elections, nor to state that they had no influence.
Three rounds are still too few to establish trends: with three rounds at intervals of about three months, some variations may still be natural sample fluctuation. For this reason, the report treats as real change only what is statistically significant within each breakdown, and classifies the rest as a “signal to watch,” to be confirmed in future rounds.
Uncertainty increases in smaller breakdowns: there is no single margin of error; it increases as the subgroup gets smaller. Breakdowns such as class A and the North and Central-West regions have small samples, and their variations should be read with caution, as they are often noise rather than trend.
Limits of the repeated panel: the panel is valuable for measuring change, but it is a small subsample that is not representative of the population. It measures change, not levels. It is subject to attrition (not everyone returns between rounds), possible conditioning (those who have answered before may respond differently) and regression to the mean (those who were very high tend to fall back, and those who were very low tend to rise). The trust groups used in the analysis of persistence have about 80 people each, and the analyses of newly known AI tools involve 28 people, so these results are indicative rather than conclusive.
Change of opinion vs. change of composition: because about 70% of this edition’s sample consists of people who had not answered before, an aggregate variation may reflect who was interviewed rather than a change in perception. The repeated panel and reweighting mitigate this risk, but the cross-sectional reading should always take this caveat into account.
Multiple comparisons: testing many breakdowns, categories and dimensions simultaneously increases the chance of finding “significant” differences by chance. A stricter criterion was adopted in these cases, but isolated signals may still be spurious until they are repeated in future rounds.
Software used
Python (pandas, NumPy, SciPy, statsmodels, Plotly and Matplotlib) and Claude Code: data processing, composite index calculation, normalization (Q1 2026 = 1.00), statistical tests (comparisons between rounds and paired panel tests) and figure generation.
Microsoft Office and Google Workspace: text editing, spreadsheets and charts.
Gemini 3.1 and ChatGPT 5.3: brainstorming, organizing information and writing support.
Adobe Creative Cloud: layout and finishing of charts and illustrations.
Ethical guidelines
Processing of personal data: the survey involved limited processing of personal data, restricted to the collection, organization and statistical analysis of the sample. The data were delivered to Reglab by Norstat without names, contact details or any other information that directly identifies respondents, only with a panelist code, used exclusively to recognize who took part in more than one round. Respondents cannot be identified, directly or indirectly, from the published information. No individual responses are disclosed, and there is no processing aimed at profiling or automated decision-making regarding participants.
Purpose and adequacy: the data were used exclusively for research purposes and for building the index, in accordance with the objectives communicated to respondents in the context of the panel.
Minimization and aggregation: published results are aggregated by category, subcategory, dimension and sociodemographic breakdown. Individual respondent scores and identifiable personal data are not publicly disclosed.
Confidentiality: individual participant information is not disclosed. The study works with consolidated presentation and structured comparisons between groups.
Methodological transparency: the index methodology has been described explicitly to allow verification, replicability and proper interpretation of the results. This commitment is consistent with Reglab’s methodological standards for public releases.
Responsible use of data: the survey measures social perceptions of digital platforms and is not intended to reinforce discrimination against groups, brands or users. Results should be interpreted with caution, especially in broad inferences and comparisons between subgroups.
www.reglab.com.br