[TABELA]
Reglab Trust and Safety Index
Reglab Trust & Safety Index
Report 1 | Q2/2026
The Reglab Index is an applied-research initiative that measures how Brazilian users perceive trust and safety in the digital environment. The Index spans different segments of the digital economy, reflecting the diversity of uses and functions of platforms in everyday life, and each category is analyzed independently, respecting its specificities of use, risk and perceived value.
Learn more at https://reglab.com.br/indice-de-confianca-reglab/.
[TABELA]
| 1.103 respondents |
Brazilian online population, +18 years old |
15-30 June, 2026 fieldwork |
24 platforms evaluated |
95% confidence level |
±3pp margin of error |
1. Overview
1.1. Reglab Index — Perceived Trust & Safety
| The Reglab Index is a composite indicator that summarizes, in a single number, trust in five broad categories of platforms (social media, streaming, platform economy, artificial intelligence and e-Government) and across four Trust & Safety dimensions (general trust, information integrity, data protection and adolescent protection). |
The Reglab Index remained stable between the first and second quarters of 2026. In practice, Brazilians’ perception of trust and safety in the digital environment did not change from one wave to the next.
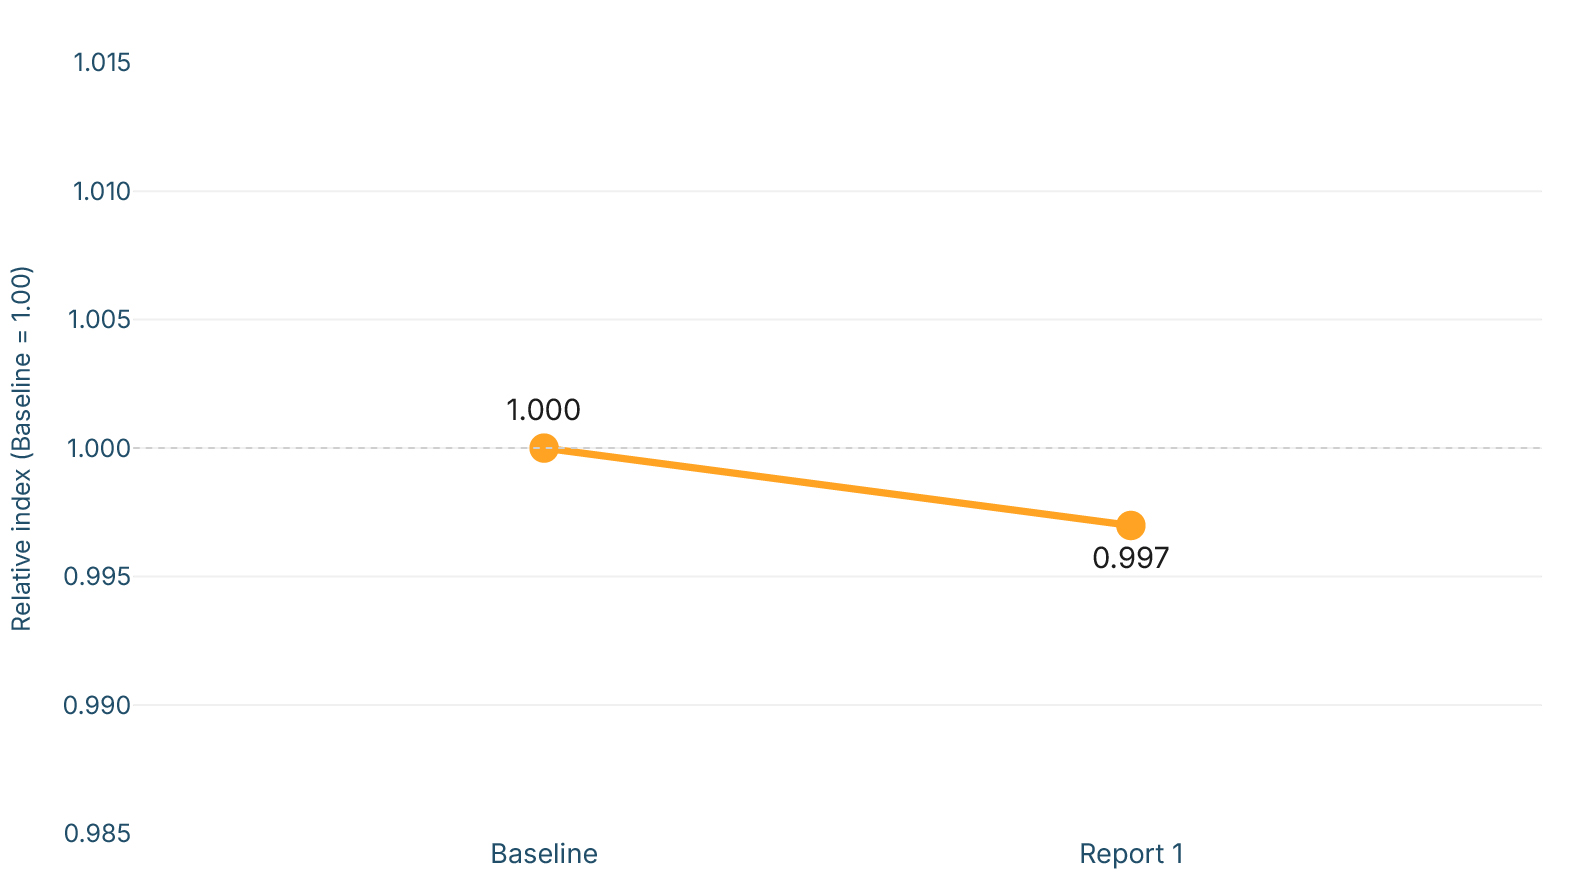
[LEGENDA]Figure 1 — Trajectory of the Reglab index (Baseline = 1.00).
Source: Reglab. Note: each unit starts from its own base (1.00) — it shows how much it moved, not the level. Small variations are signals to watch.
Stability was expected, since only a few months separate the two surveys. The result reinforces the consistency of the Index, which did not react to sample fluctuations (in this cycle, 80% were new respondents). This solidity will make it possible to identify eventual movements in future cycles with greater confidence.
1.2. Index by category
Looking at each category against its own baseline, stability is confirmed: none moved enough to constitute a trend. Artificial Intelligence and e-Government showed a slight rise; Social Media and Streaming & Entertainment edged down; the Platform Economy stayed still. These are small movements — for now, signals to watch, not confirmed changes.
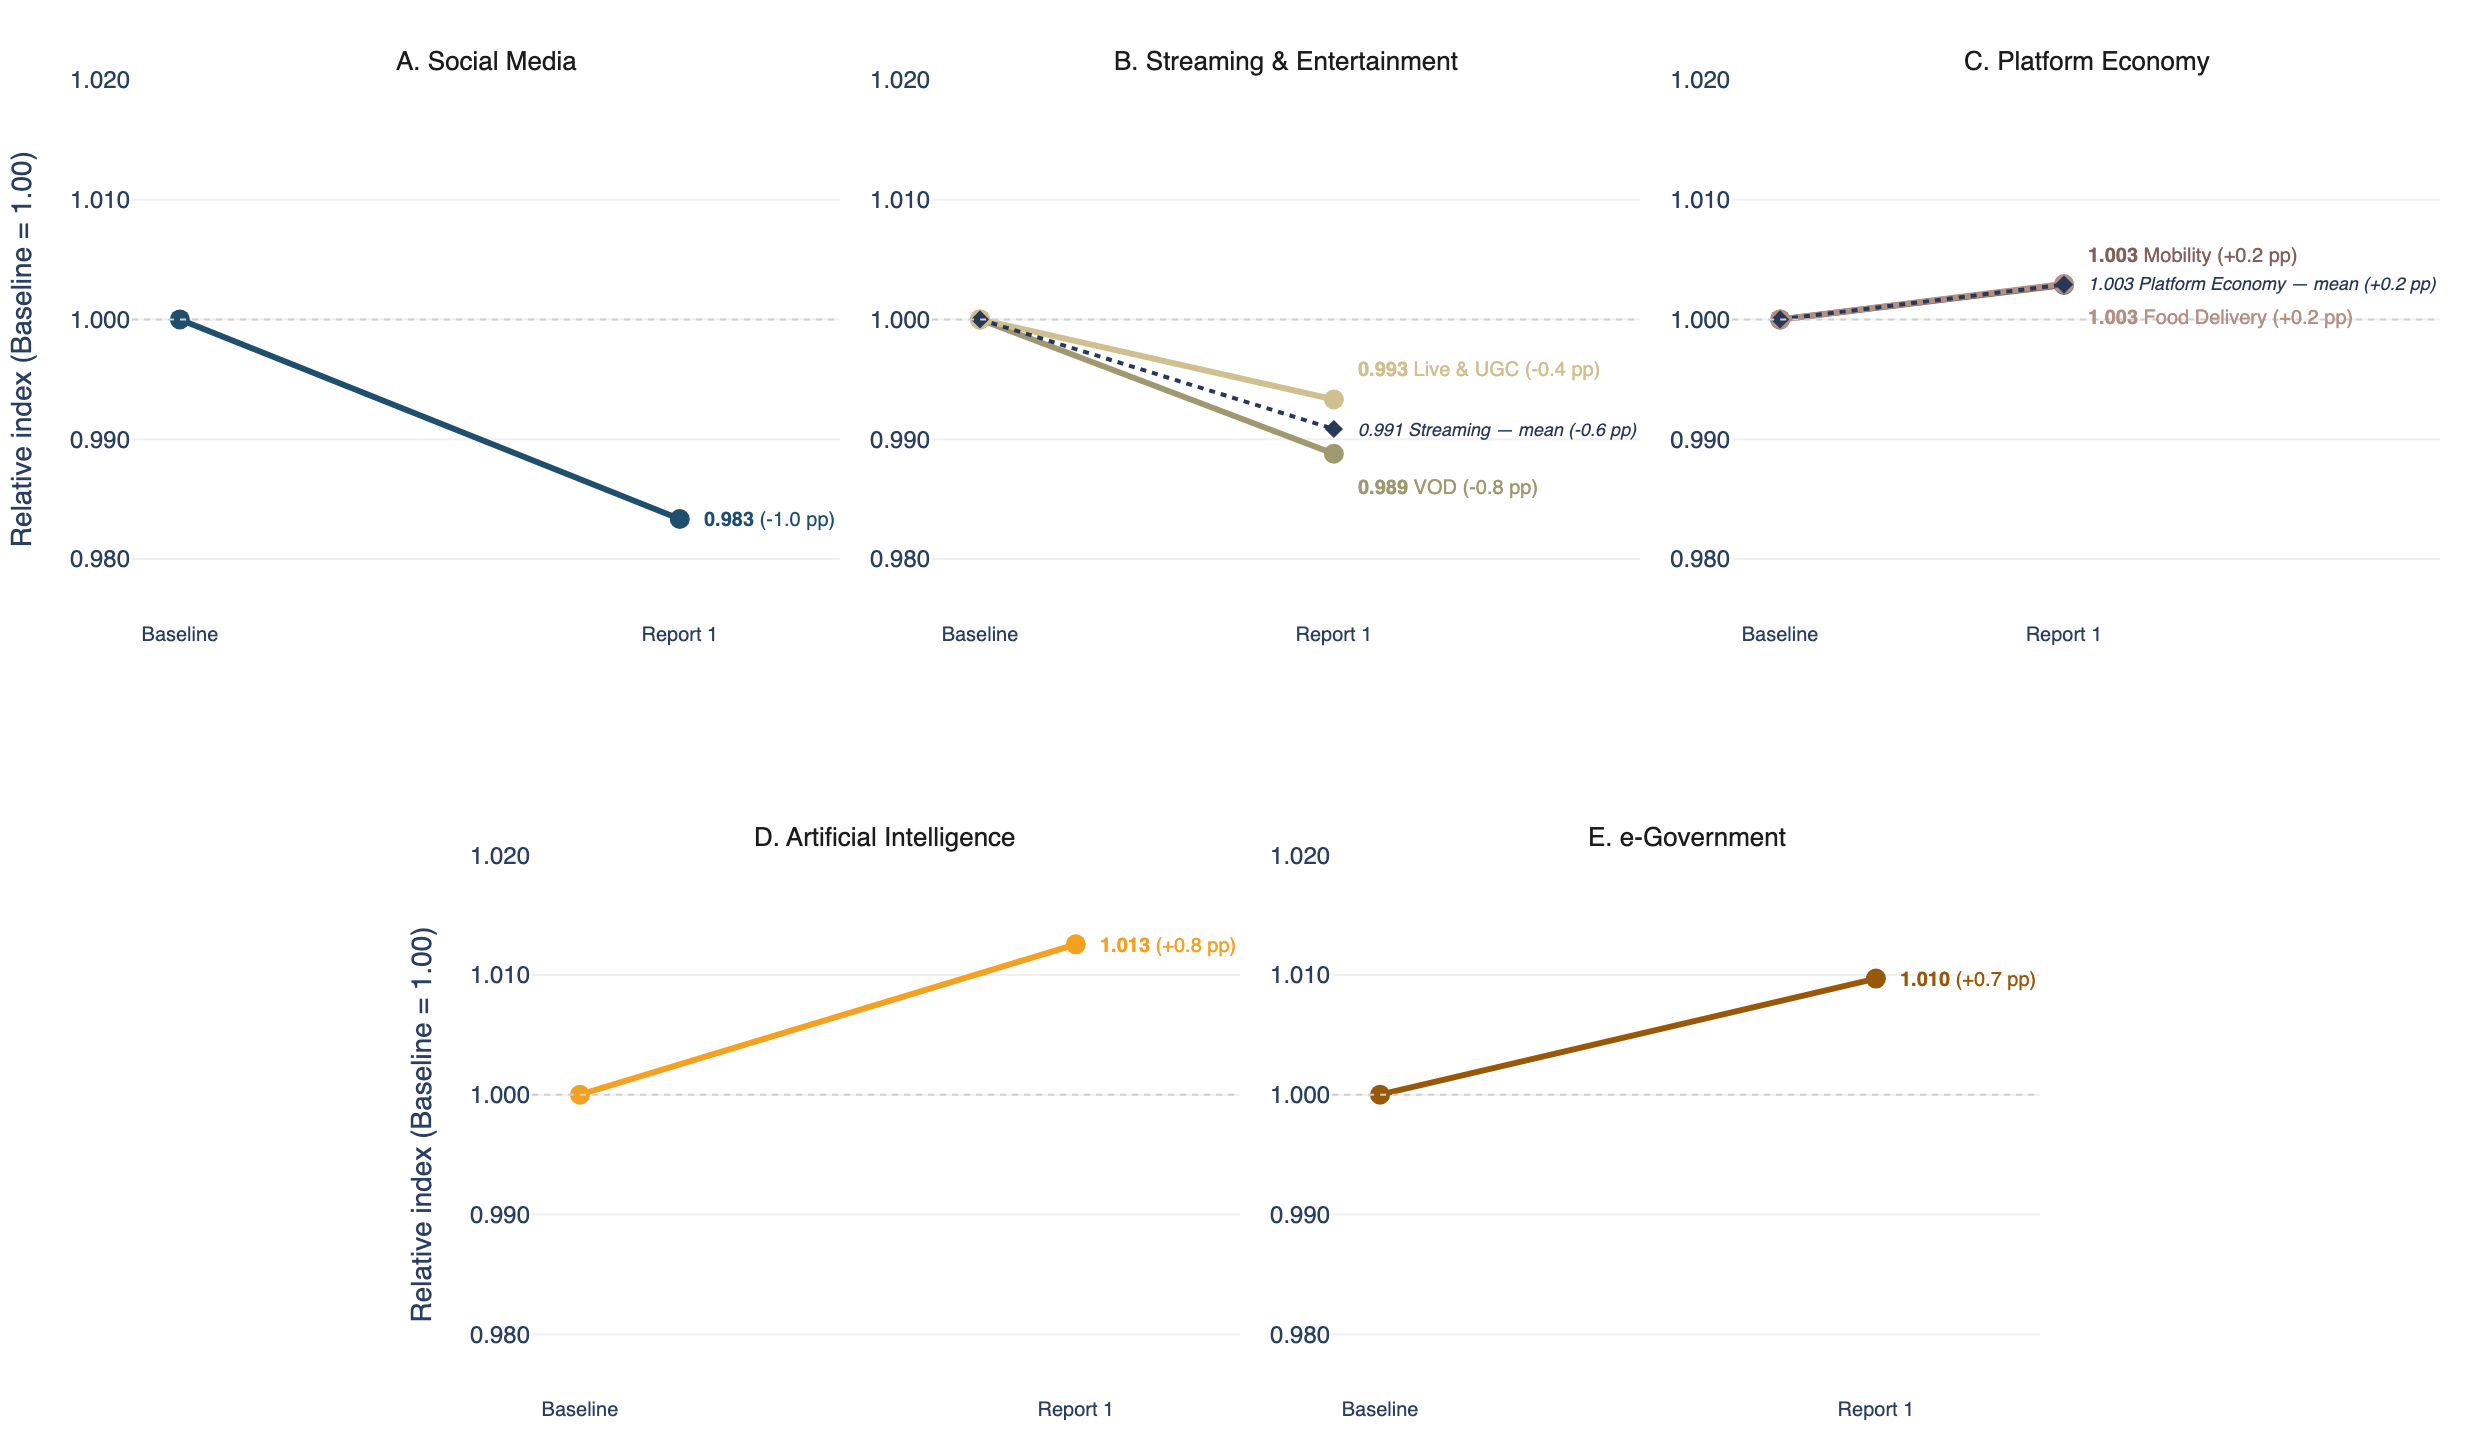
Figure 2 — Trajectory of the Reglab index by category and subcategory (Baseline = 1.00).
Source: Reglab.
1.3. Dimensions of Trust and Safety
The four dimensions measure different aspects of Trust & Safety: general trust, information integrity, data protection and adolescent protection. The differences fall within the survey’s margin of error, with a signal of decline in child and adolescent protection to be watched in future rounds.
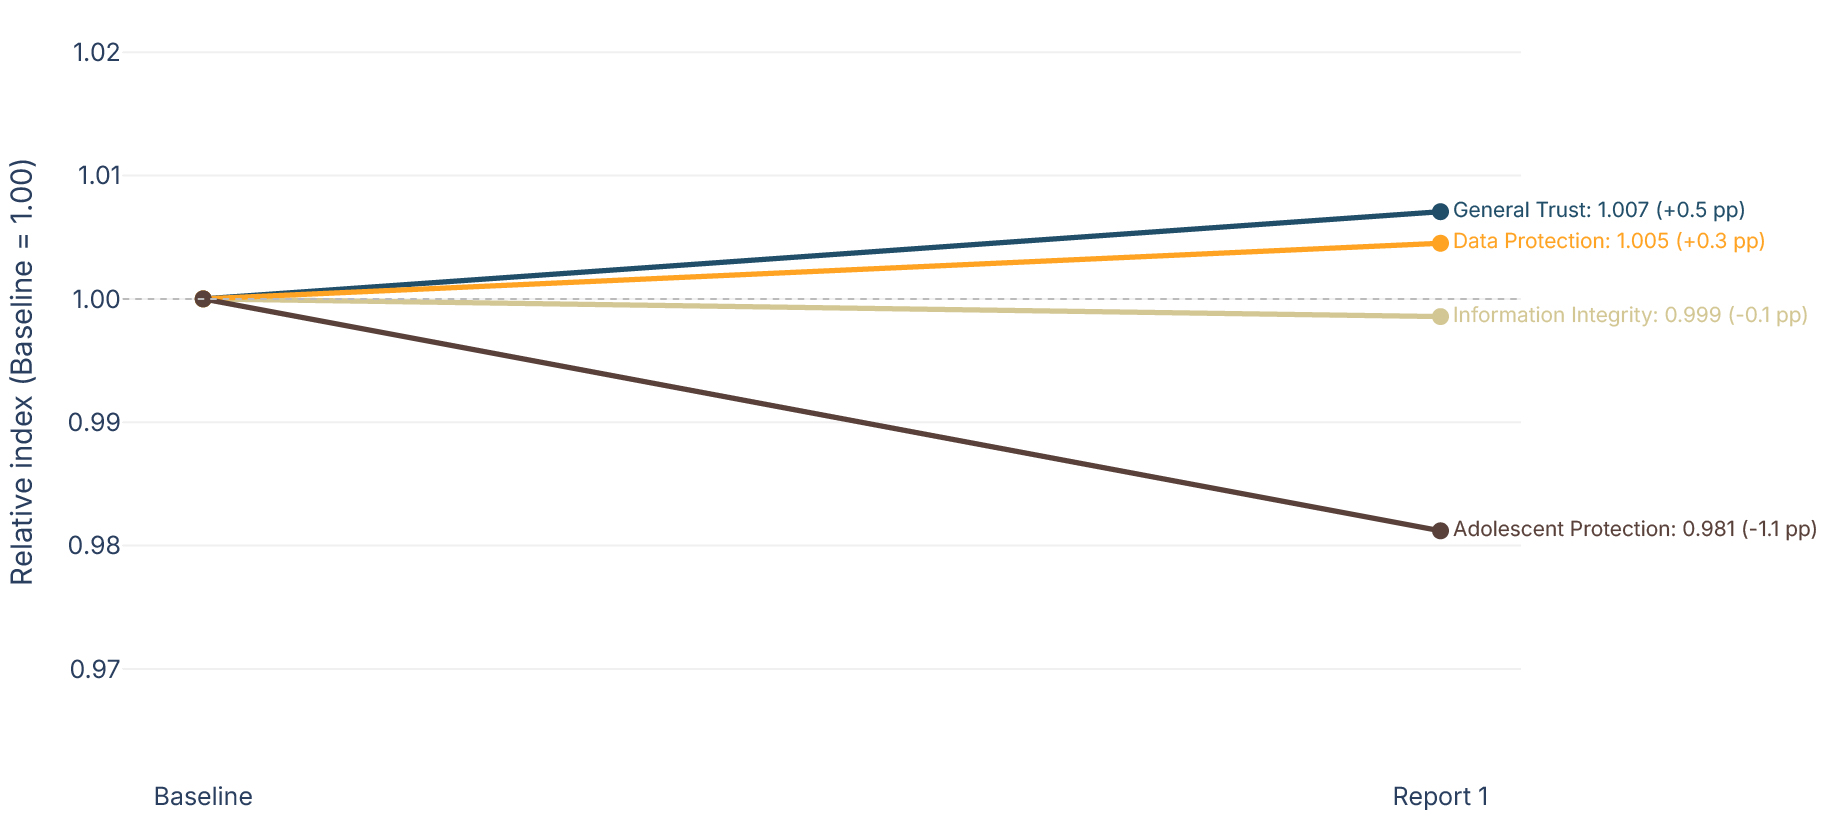
Figure 3 — Evolution of trust by dimension (Baseline = 1.00).
Source: Reglab. Note: general trust, information integrity, data protection and adolescent protection.
1.4. Categories vs. Dimensions
Even though the movements are within the margin of error, adolescent protection is the dimension with the largest negative variation, driven by social-content environments. e-Government and the Platform Economy remained stable. Artificial Intelligence, in turn, shows a positive signal, especially in data protection and general trust.
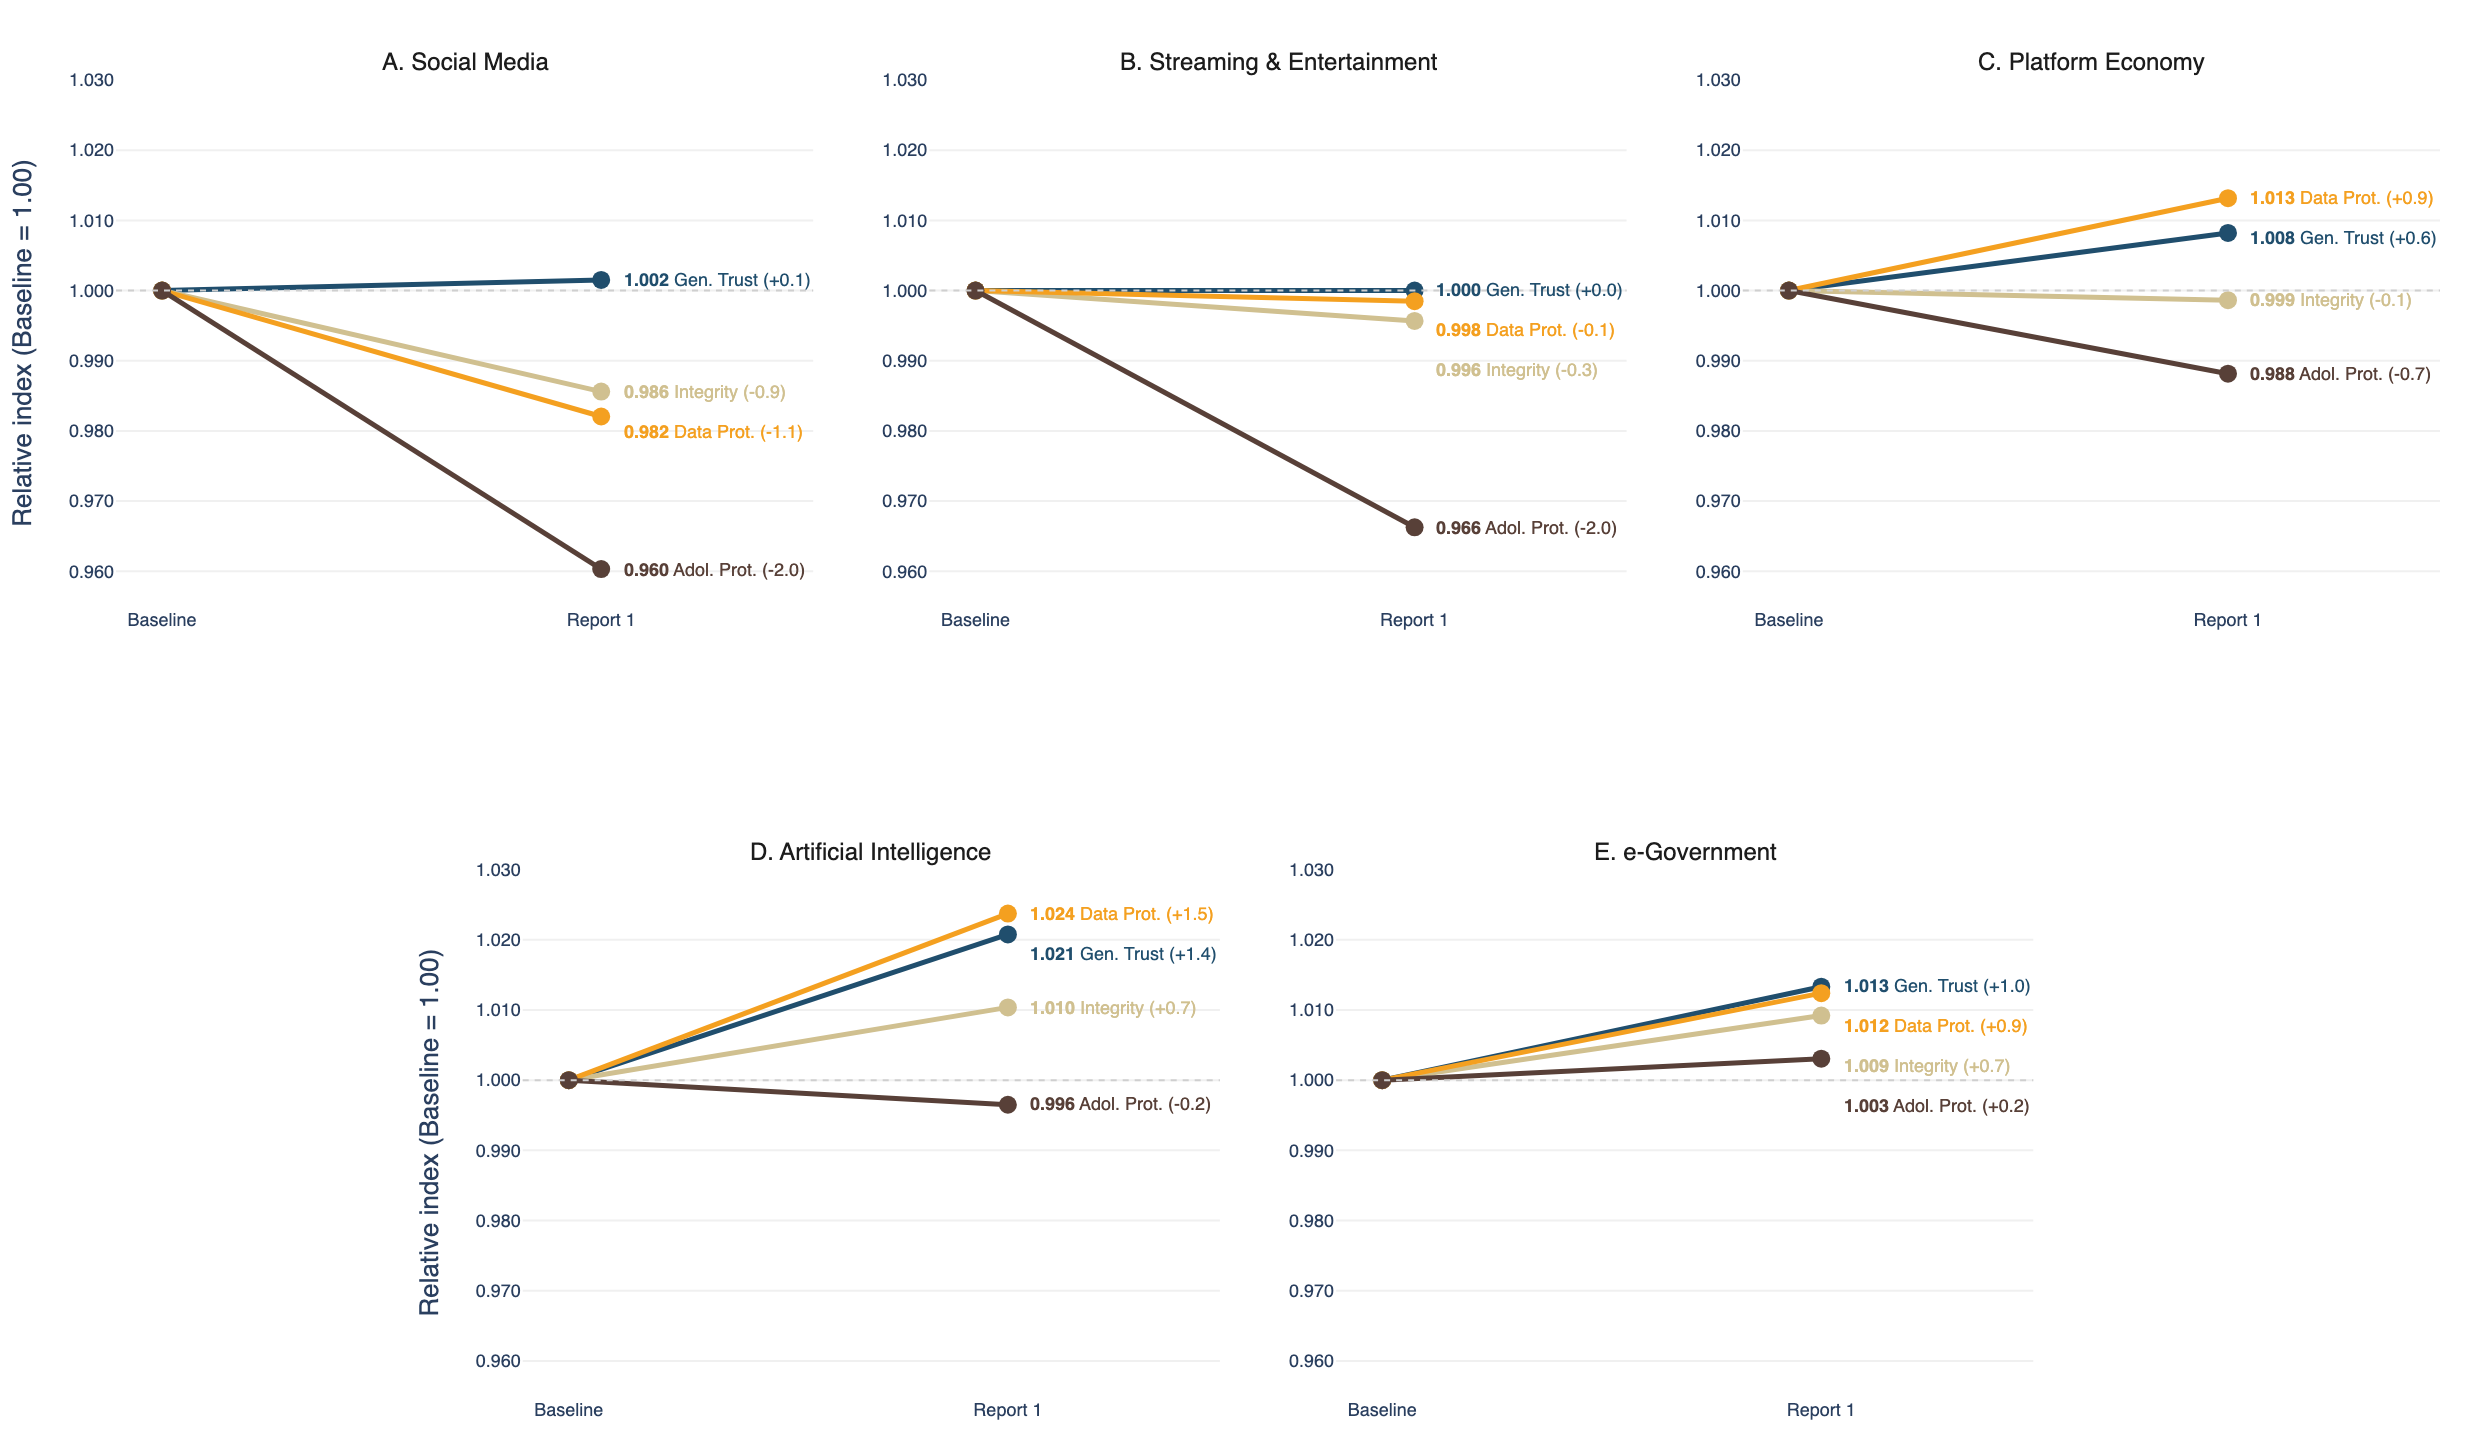
Figure 4 — Profile of the dimensions within each category (Baseline = 1.00).
Source: Reglab. Note: adolescent protection is the lowest dimension across all categories.
1.5. Demographics
Report 1 confirms the two central theses of the Baseline Report: the confidence gap between Millennials and Generation Z, and the trust divides across social classes.
Brazilians aged 25–34 remain the most trusting, keeping a meaningful distance from the 18–24 group. The main movement, however, came from older respondents: trust rose among people aged 45–54 — unlike every other age group. As these subgroups are smaller, the result is still a signal to watch.
By social class, the pattern held: class A at the top, followed by classes B, C and D-E. This income ladder is, so far, one of the study’s most solid and persistent marks. There was a movement to watch: class A edged down and class B rose the most, bringing the two closer together.
By gender, the difference is the narrowest of all: men and women nearly tie on the overall index, and that proximity held — though with differences in specific dimensions, as discussed in Section 2.
Finally, by region, the levels follow the Baseline map: Northeast (67.5) and South (67.2) ahead, Southeast in the middle (66.0), North (64.5) and Central-West (63.6) behind — with the Central-West posting the study’s largest drop. Because regional samples are the smallest (especially North and Central-West), these movements are signals to watch longitudinally.
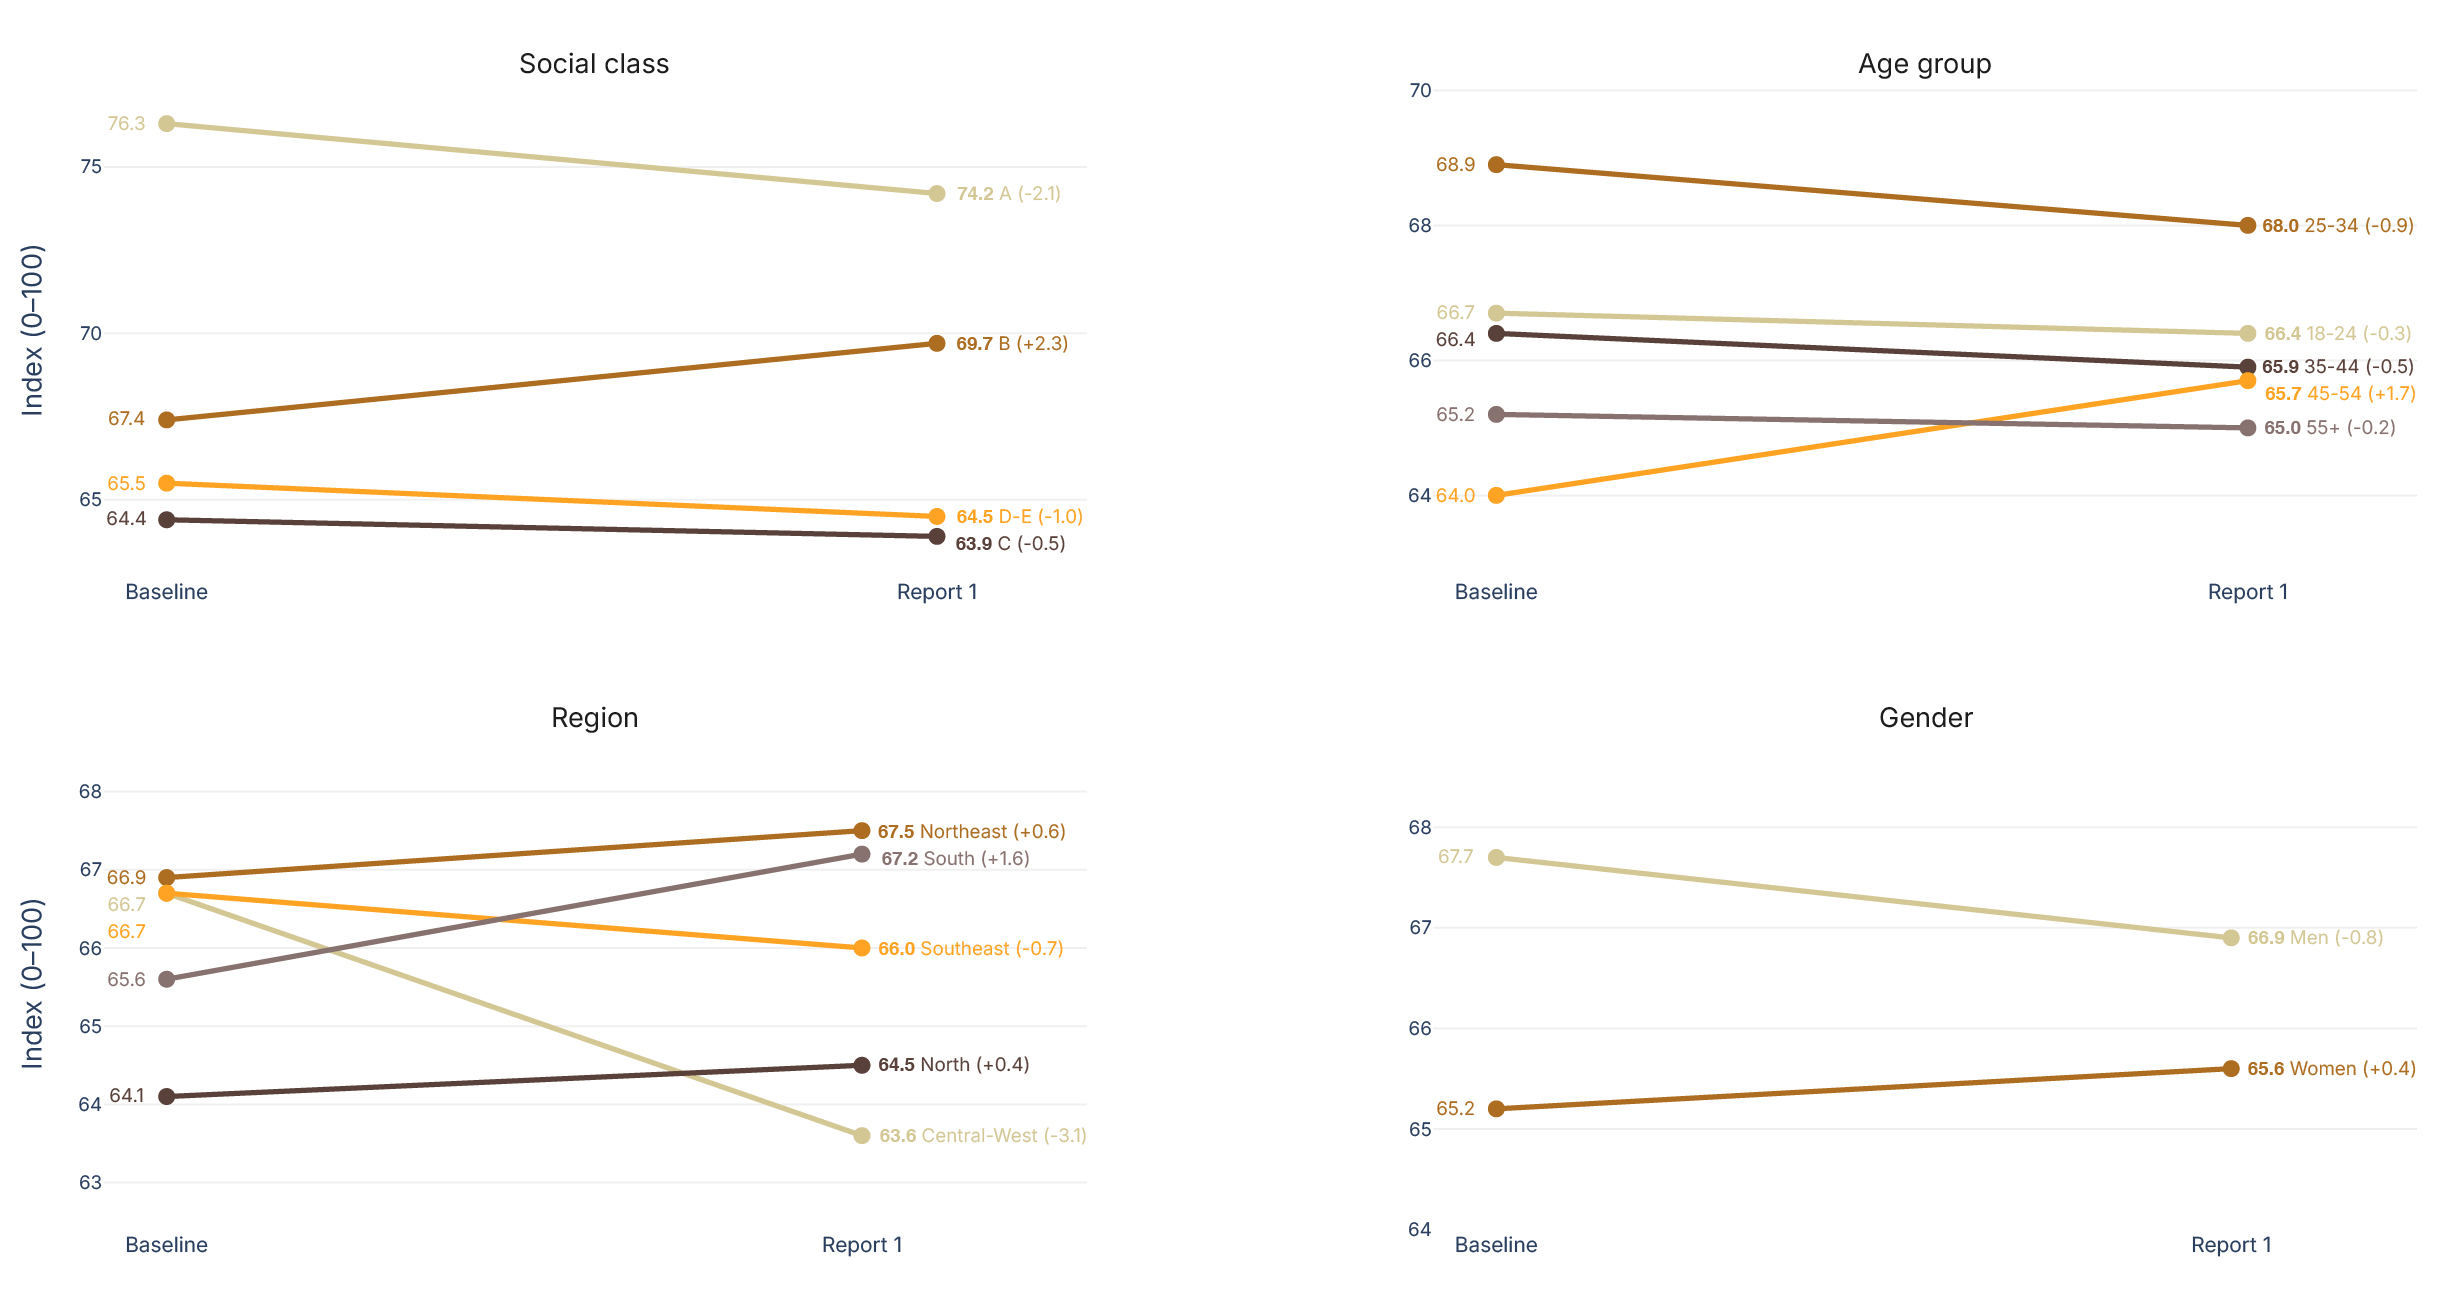
Figure 5 — Trust index by social breakdown — class, age group, gender and region (absolute values).
Source: Reglab. Note: 0–100 scale. Smaller breakdowns (class A, North, Central-West) carry greater uncertainty.
[IMG:Figure06_region_map.jpg]
Figure 6 — Trust index and change by region (absolute values).
Source: Reglab. Note: regional samples are the smallest in the study — variations call for caution.
1.6. Awareness
Before closing the overview, a look at awareness: how many people actually know each platform. Here the picture is near-saturation: most platforms are already known by more than 90% of connected Brazilians — YouTube, Gov.br and Instagram get close to 100% — and these levels barely move from one wave to the next.
[IMG:Figure07_awareness_platform.jpg]
Figure 7 — Awareness by platform (Baseline → Report 1).
Source: Reglab. Note: % who report knowing each platform.
The main highlight was Claude, with awareness jumping from 72% to 77%, above the margin of error. Although AI is the most unequal category in awareness — the gap between upper (A/B) and lower (C/D-E) classes is +6.0 points — it was precisely in AI that the base of the pyramid advanced the most: class D-E rose from 79% to 84% awareness of AI, the largest gain of any class in any category — a signal to watch in the coming cycles.
It is important to note that the Reglab Index measures perception, not use. A tool being known means it has entered that person’s cultural repertoire and may even signal desire worth investigating (as happens with luxury brands). Actual barriers to use of specific technologies should be analyzed by other instruments.
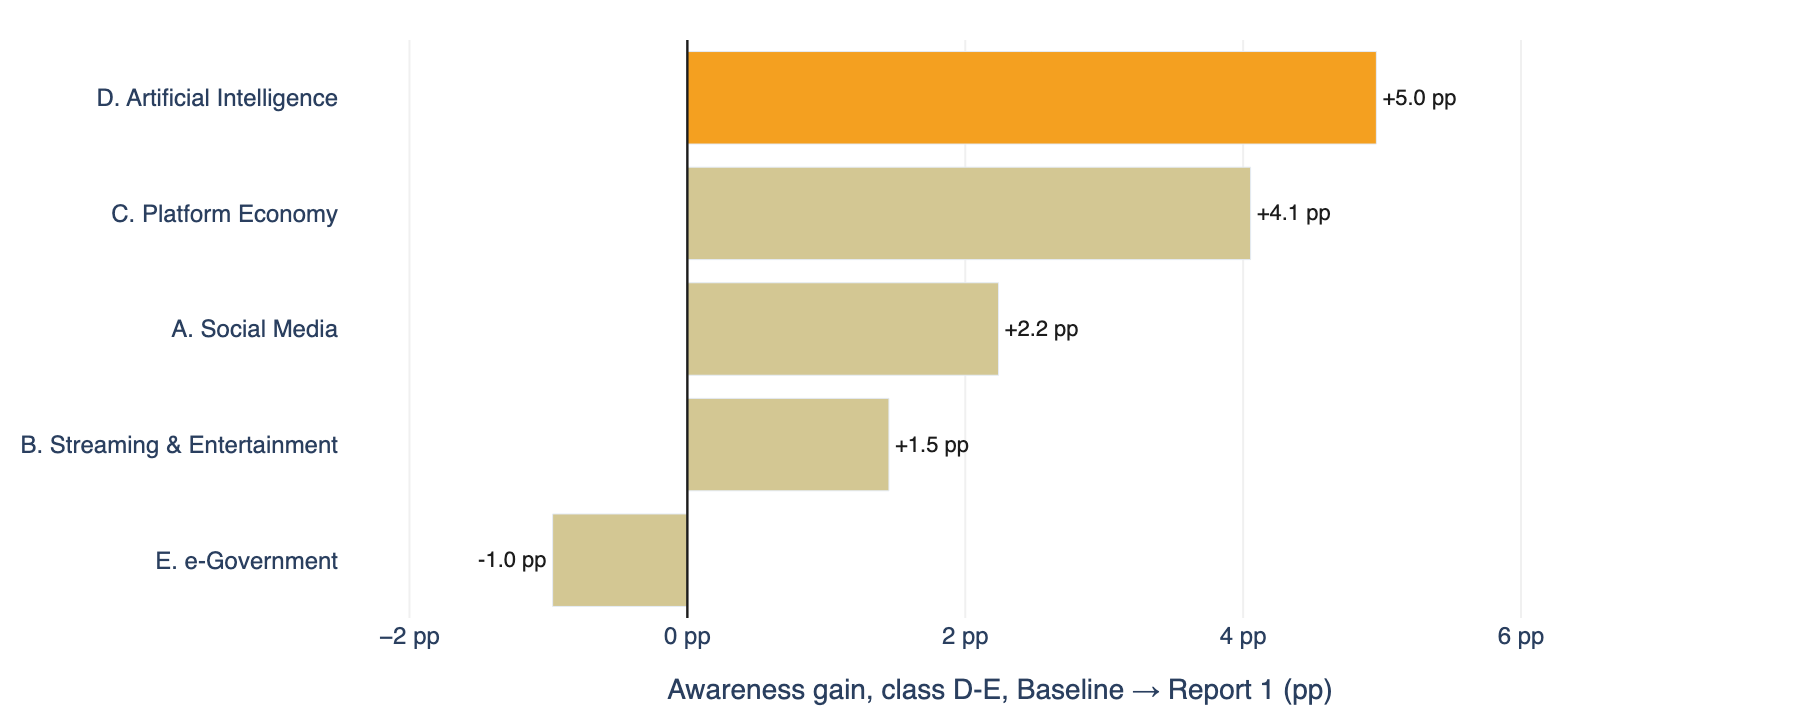
Figure 8 — Awareness gain by category among classes D-E (Baseline → Report 1).
Source: Reglab. Note: AI leads the diffusion of awareness to the base of the pyramid — a gain still at the limit of what the survey can distinguish (a signal to watch).
2. Other Highlights of This Edition
This edition showed a stable picture — but stability overall does not mean nothing happened. Three movements deserve attention: the most marked gender differences (in adolescent protection and mobilit), the leap of e-Government in the South, and the movement of artificial intelligence.
2.1. Gender Differences
Men and women nearly tie on the overall Index (66.9 vs. 65.6), but they diverge on adolescent protection. Women trust almost 6 points less than men in this dimension, repeating the largest contrast already observed in the Baseline. The most likely reading points to the caregiving role historically assigned to women, who tend to follow more closely the online lives of children and dependents and are, therefore, more skeptical in their perceptions of trust and safety.
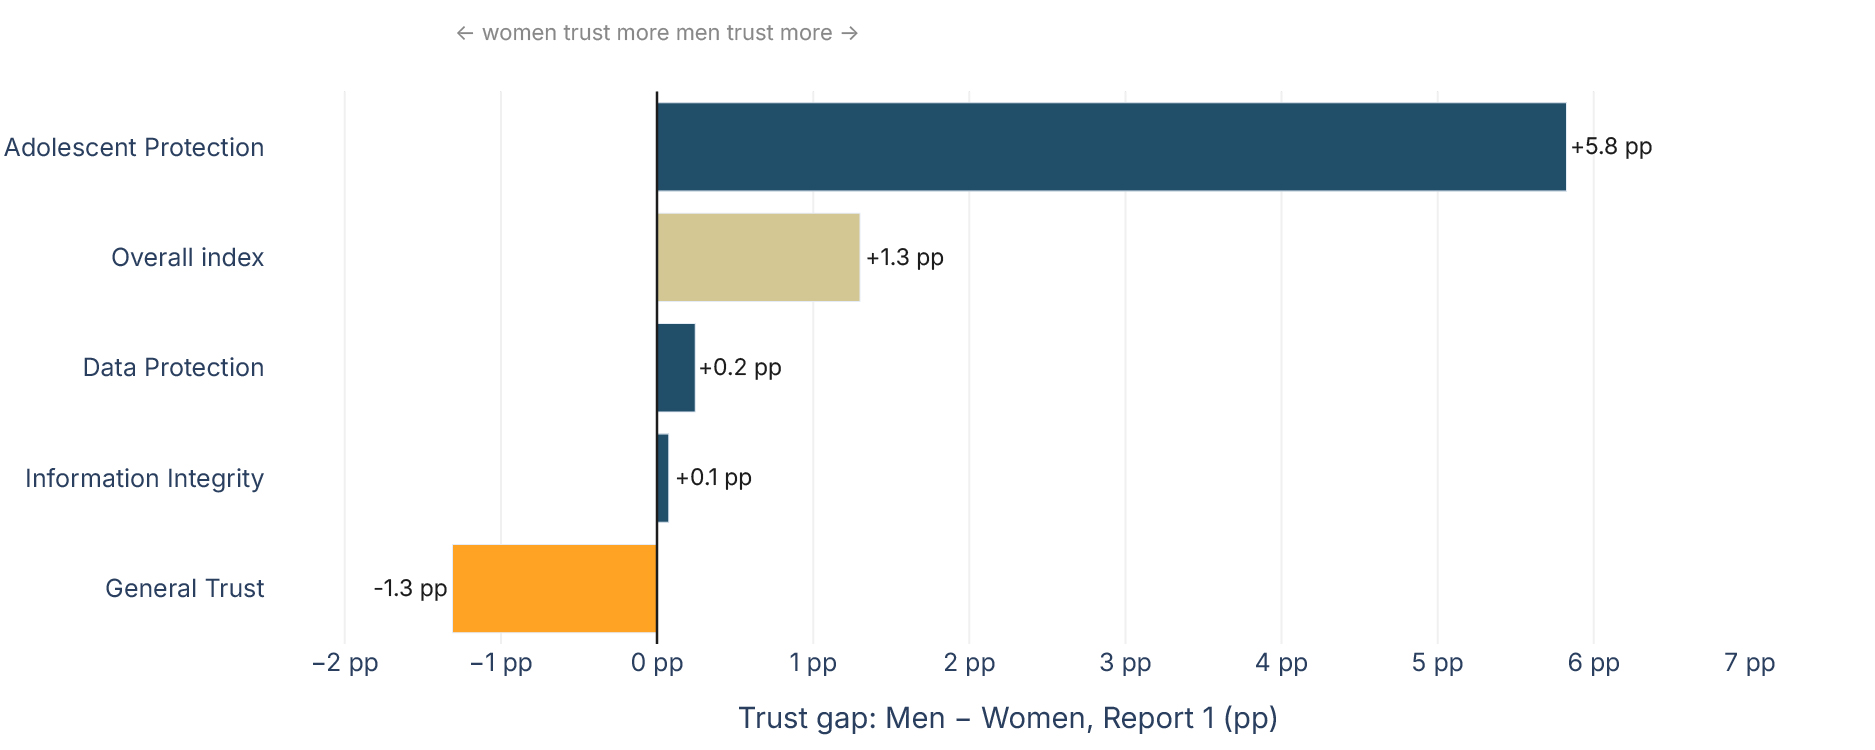
Figure 9 — Trust gap between genders, by dimension (Report 1).
Source: Reglab. Note: positive = men trust more; negative = women trust more.
Gender differences shifted across several categories, but there is not yet enough evidence to treat these movements as a trend. Most variations may result from sample fluctuation and, without a clear national factor explaining the set of changes, the most prudent reading is to treat them as signals to watch in the coming editions.
[TABELA]
| Categories |
Baseline |
Report 1 |
| Live content |
+3.6 |
+3.4 |
| Mobility |
+5.2 |
+3.0 |
| Social Media |
+3.5 |
+2.5 |
| Artificial Intelligence |
+2.3 |
+2.4 |
| Food Delivery |
+2.1 |
+1.4 |
| VOD (movies & series) |
+2.3 |
+0.4 |
| e-Government |
+0.3 |
-2.3 |
[/TABELA]
Table 1 — Trust gap between genders, by category (pp).
Source: Reglab. Note: positive = men trust more; negative = women trust more.
2.2. e-Government: The leap in the South
Across regions, almost every movement is small and unstable — except in the South, where perceived trust and safety in e-Government leaped (+5.5 points), large and consistent enough to be treated as a trend. It stands out even more because, in the Baseline, the South was among the regions that trusted this kind of service the least.
It was a turnaround — but one that seems to confirm a key Baseline finding**: the evaluation of e-Government platforms incorporates political and institutional trust in the government that operates them**. Cross-referencing our findings with the federal-government approval surveys published by Quaest in April and July 2026 (with fieldwork less than 10 days apart from the Reglab Index), we note that the South, although it remains the region with the highest disapproval of the government, was also the one that grew the most in approval, likewise an increase of 5.5 percentage points.
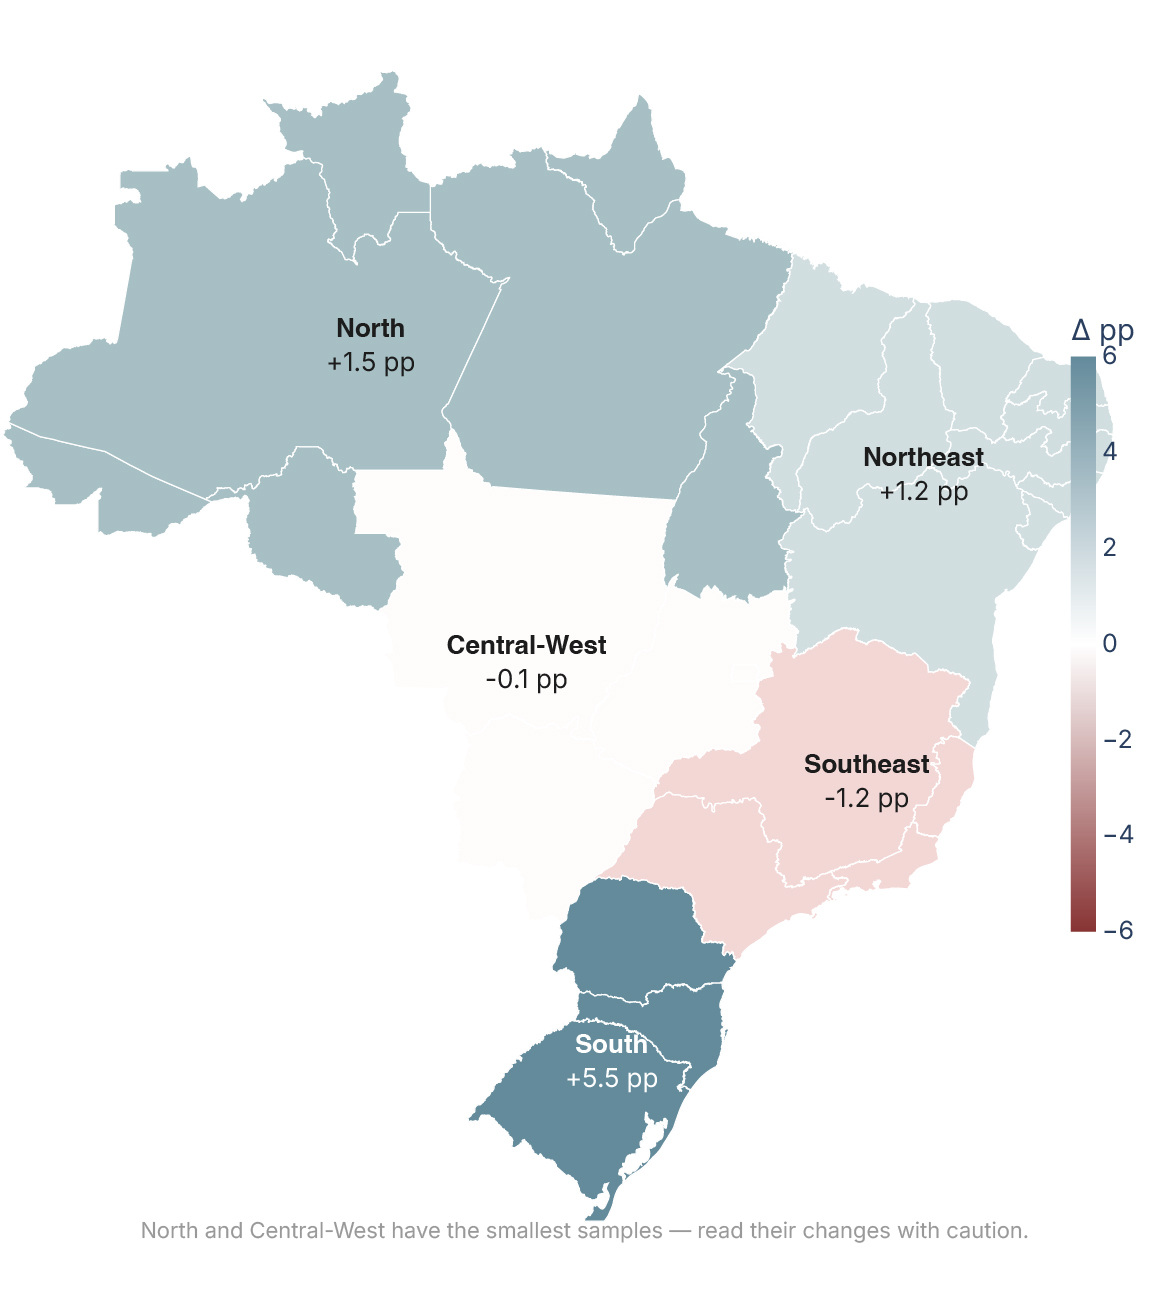
Figure 10 — Change in trust in digital government by region (Baseline → Report 1).
Source: Reglab. Note: the South's jump stands out.
It is worth mentioning that this number must be highlighted: among all regions this leap is the only one which is statistically significant. All the other regional changes are smaller than the error margin and attributable to the small samples sizes. In other words: almost all the variations are just noise, with the exception of the South.
2.3. Trus follows Income
The recurring insight (already presented in the Demographics section) is income: trust follows social class, and that ladder holds stable between the waves. More than describing this inequality again, it is worth asking what it means.
The very stability is revealing: the difference between classes is not a swing of mood, but a reflection of deeper inequalities of qualified access, resources and experience that do not dissolve in a few months. Less than the platforms' technical design, what weighs is the inequality of resources and experience between classes.
In other words: those with higher income trust more in the digital environment. This inequality, however, is not uniform across dimensions — it deepens precisely in the most sensitive one, adolescent protection, where the gap between upper (A/B) and lower (C/D-E) classes is the largest in the whole study: +8.6 points.
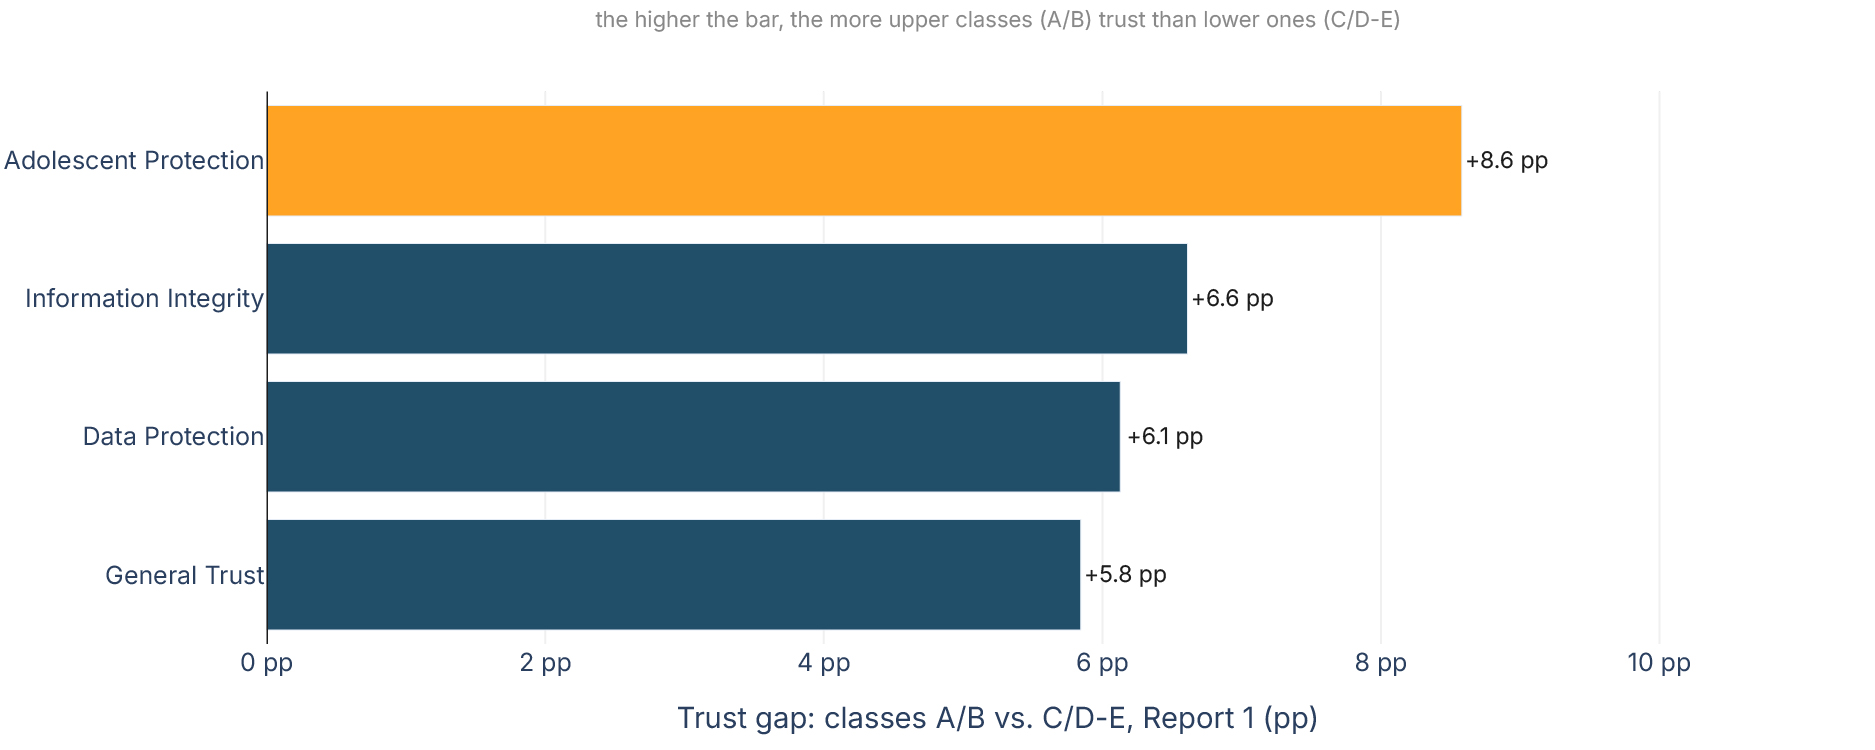
[/LEGENDA]Figure 11 — Class gap by dimension: trust difference between classes A/B and C/D-E (Report 1). Source: Reglab. Note: the higher the bar, the more the upper classes trust. Adolescent protection is the dimension that most separates classes. [/LEGENDA]
The same holds for gender: women are also the most skeptical in this dimension. Put plainly: it is lower-income families and women who least believe platforms protect children and adolescents — a point the Analysis revisits in light of the ECA Digital.
2.4. Artificial Intelligence
The strongest signal of the edition comes from a special part of the sample. A slice of respondents — about 20% (209 people) — had already taken part in the Baseline and were interviewed again. This is our repeated panel, following the same people over time. It is more precise at flagging real change, because it compares each person with themselves, cancelling much of the noise that arises when comparing different people.
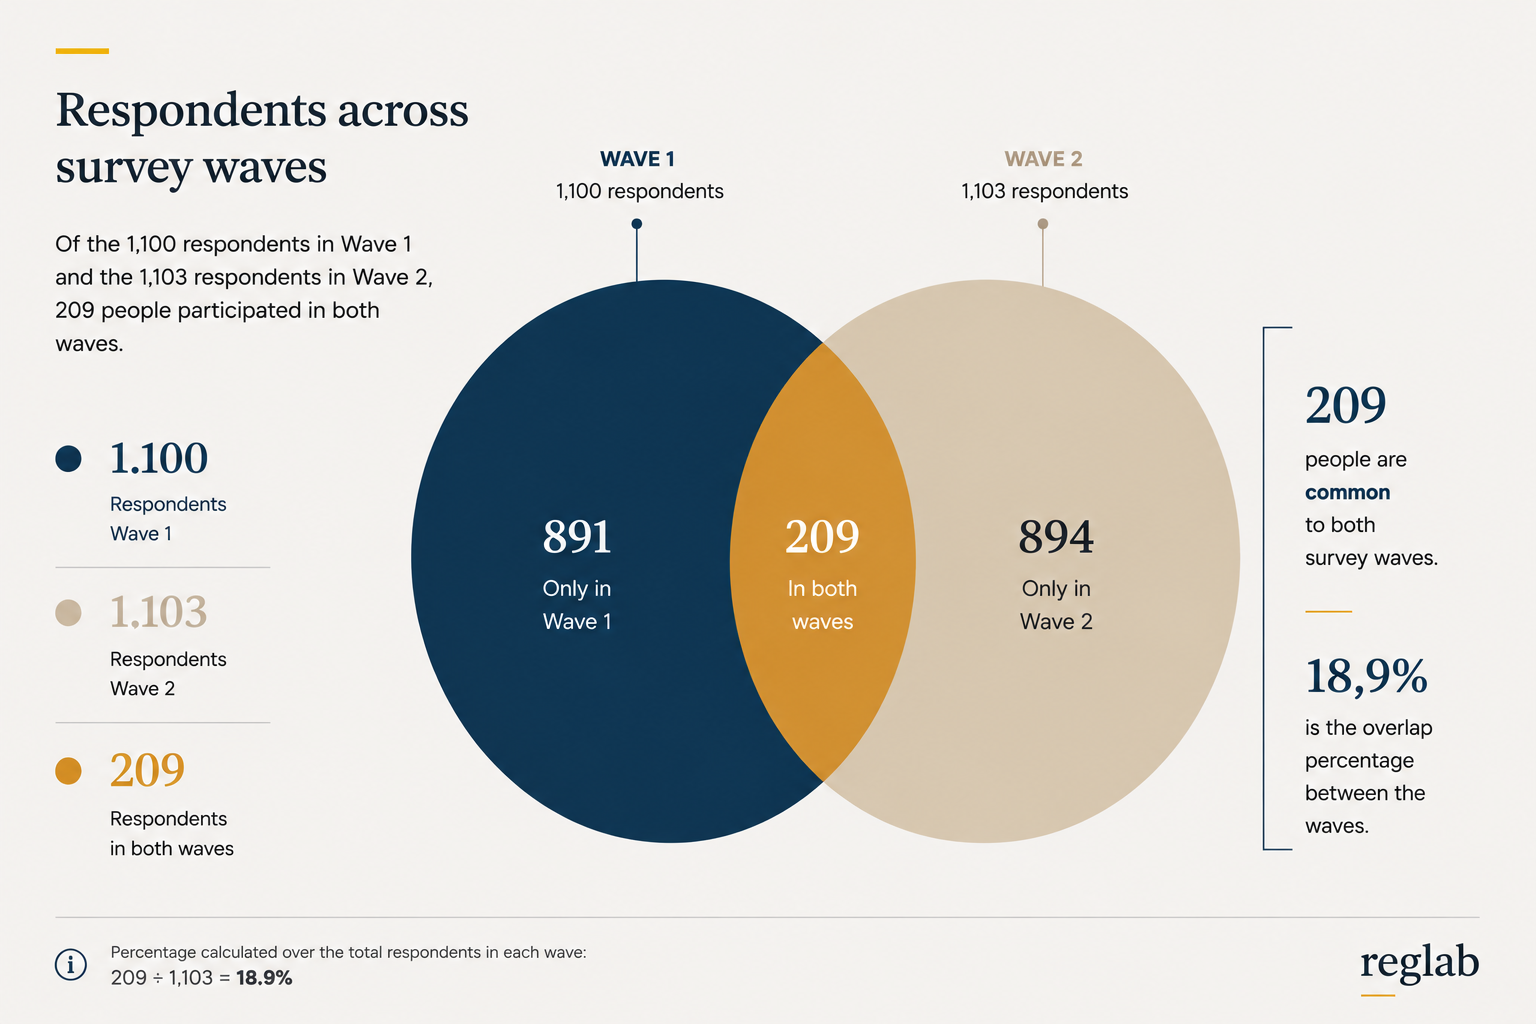
Figure 12 — Representation of the Repeated Panel.
Source: Reglab.
| Why a repeated panel matter Think of a class of students: to know whether they learned, you compare their grades at the end of the course with their own grades at the start — not with those of some other class. It is the same with opinion: to know whether trust changed, the ideal is to ask the same people again. That is what the repeated panel allows: separating a real change of opinion from a simple change in who was heard. And, because it compares each person with themselves, it adds precision and helps capture small movements that would be lost in the natural churn of a new sample. |
That is how we identified one of the most consistent signals of this cycle: the rise in perceived trust and safety in artificial intelligence, the only category that rose consistently (+3.1 points).
The most likely reading is of a technology in the adoption phase, with trust rising from a low base and pulled by those arriving now. Another possible correlation is with the advertising campaigns run by OpenAI (ChatGPT) since May, and Google (Gemini) during the World Cup, with frequent brand exposure on broadcast TV, digital channels and out-of-home media.
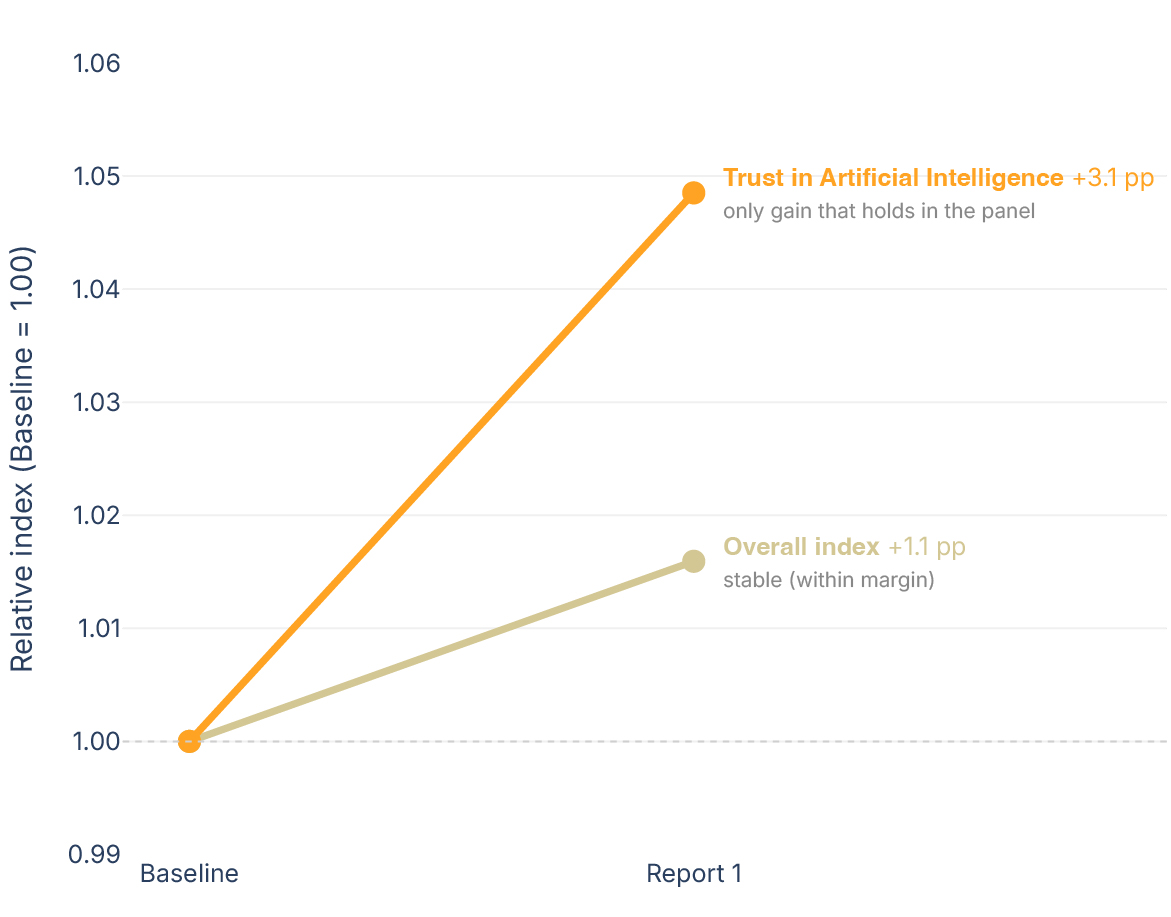
Figure 13 — Trust in artificial intelligence vs. overall index, in the repeated panel (Baseline = 1.00).
Source: Reglab. Note: same respondents in both waves (N = 209). While the overall index rises modestly, trust in AI rises consistently (+3.1 points).
| This section analyzes the survey results, relating them to academic literature and expert opinion, through the authors' lenses. |
The overall Index remained stable even in a period marked by high-profile events: the implementation of the ECA Digital, the advance of the debate on AI regulation and digital competition, and a World Cup broadcast on digital platforms. This stability is consistent with a classic distinction in communication studies: public exposure can make a topic more visible without changing, at the same pace, how people evaluate it (McCombs and Shaw, 1972).
The ECA Digital offers the clearest example. The Baseline was carried out in the same fortnight the law entered into force, amid press coverage and government communication. Three months later, trust in adolescent protection remains practically at the same level. This does not mean the law is irrelevant – its implementation is still in its early stages, with regulation and monitoring under way. But the result reinforces what theory calls policy feedback (Pierson, 1993): passing a law, on its own, does not immediately change users' perceptions.
There is still a further layer of inequality that reinforces the urgency of the topic. Adolescent protection is not only the most fragile dimension, it is also the most unequal in the whole study. By income, the gap is the largest across all dimensions: class A perceives it +10.8 pp above the mean, while class C sits 3.4 pp below. By gender, it is the only dimension where men and women clearly diverge (women perceive it about 6 percentage points lower). In other words, it is women and people in classes C/D-E who least believe that platforms protect adolescents.
The same applies to the legislative agenda. Discussions on AI and digital competition occupied companies, government, Congress and the specialized press, but do not appear as a rupture in the population's trust. The result may also reflect the existence of issue publics: groups that follow certain topics with high intensity, while most of the population maintains limited contact with the debate (Krosnick, 1990).
The World Cup reinforces this separation between use and trust. Millions of Brazilians watched the matches and interacted on digital platforms, but trust in social media and streaming barely changed — for better or worse. This shows that a platform can occupy the center of cultural life without users revising their assessment of its safety, information or adolescent protection.
AI was the main point outside the stability trend, and this movement is consistent with a technology in diffusion: new groups first come to recognize it and, later, form assessments based on use and experience.
The AI advertising campaigns during the World Cup may have contributed to this visibility, but the data do not allow isolating it as a cause. Knowing, using and trusting are different stages. Familiarity can raise trust when tools deliver value, but it can also make frequent users more critical. This also helps explain why trust appears to be rising among older people and receding among the young. The Index may be recording not only the expansion of adoption, but the beginning of a more calibrated trust.
On e-Government, the leap observed in the South confirms the Baseline finding and offers a solid direction: the evaluation of the apps absorbs the perception of the government itself. This association carries an institutional risk: although Brazil has relevant digital-government capabilities, technical quality does not eliminate the influence of the political context on users' perception.
The result is consistent with studies that treat trust in government and trust in technology as related components of the adoption of digital public services (Bélanger and Carter, 2008).
Technically sound services can lose trust when the political assessment worsens; distrust, in turn, can reduce their use — and the response may lie not only in institutional campaigns, but in continuous communication, a stable identity and use experiences that make clear that digital services remain public, reliable and available regardless of the government of the day.
References
[REF]
BÉLANGER, F.; CARTER, L.. Trust and risk in e-Government adoption. The Journal of Strategic Information Systems, v. 17, n. 2, p. 165–176, 2008
MCCOMBS, M. E.; SHAW, D. L. The agenda-setting function of mass media. Public Opinion Quarterly, v. 36, n. 2, p. 176–187, 1972.
KROSNICK, J. A. Government policy and citizen passion: a study of issue publics in contemporary America. Political Behavior, v. 12, p. 59–92, 1990
PIERSON, P. When effect becomes cause: policy feedback and political change. World Politics, v. 45, n. 4, p. 595–628, 1993.
[/REF]
Methodology Annex
About Reglab
Reglab is a private research center that produces studies and strategic consulting for companies, associations and policymakers operating in technology, media and regulated markets. We are obsessed with data, rigorous methods and translating evidence into practical, actionable language. Learn more at www.reglab.com.br.
Acknowledgements
Executive Director: Pedro Henrique Ramos Research Director: Marina Garrote
Head of the Applied Economics Unit: João Ricardo Costa Filho
Authors: Thais Palanca da Silva and Pedro Henrique Ramos
Researchers: Thais Palanca da Silva, Isabella Crispi, and Thaís Rocha Final Layout: Larissa Camargo
| Suggested citation: PALANCA, T.; RAMOS, P. H. Reglab Trust & Safety Index in the Digital Economy. 1st Edition – 2nd quarter of 2026. São Paulo: Reglab, 2026. |
[MT]Research Question
[MX]How do connected Brazilian adult internet users perceive trust and safety across the main digital platforms that are part of their daily lives, considering different service categories and four specific dimensions of assessment? How has this perception of trust and safety among Brazilians evolved between the Baseline Survey (1st quarter of 2026) and the 2nd quarter of 2026, and how is it distributed across category, dimension and sociodemographic profile?
[MT]Methodology Summary
[MX]Quantitative research based on a structured national survey, with a five-point Likert scale converted into a composite Trust & Safety index (0–100). Report 1 is the first wave to be compared against the baseline established in the Baseline Survey: results by category, subcategory, dimension and platform are presented in normalized form (base = 1.00 at Baseline), and a repeated-panel subsample makes it possible to measure change of opinion within the same people.
[MT]Data Collection
[MX]Data collection was carried out through a structured national online panel run by Offerwise, a company specialized in digital surveys and opinion studies, with a 95% confidence level and a margin of error of ±3 percentage points. Quotas were applied by age group, social class, geographic region and gender. Offerwise operates a proprietary panel, recruited and managed entirely in-house. Participation is voluntary, subject to acceptance of the Terms of Use and Privacy Policy. Respondents receive incentives for each completed survey, which tends to increase engagement and response quality. To ensure that each respondent is a real and unique person, we use multiple layers of control. These include reCAPTCHA at sign-up and login, preventing automated access; and IP validation and geographic consistency checks (GEO IP), with permanent deactivation of accounts in the event of confirmed inconsistencies. Responses were recorded on a five-point Likert scale, from “strongly disagree” to “strongly agree”, with two additional options for non-substantive responses: “I don’t know” and “I don’t know this platform”. These responses were treated as missing information and excluded from the index calculation for that specific platform.
[MT]Data Analysis
[MX]The analysis was conducted through descriptive statistics and the construction of a composite indicator. In the first step, each Likert-scale response was converted into a numeric value from 1 to 5 and then transformed onto a standardized 0-to-100 scale. In a second step, for each platform we computed the arithmetic mean of the scores in each of the four dimensions. The platform’s composite indicator was the simple mean of these four dimensional averages, assigning equal weight to each dimension. In a third step, results were aggregated by subcategory and category, also by simple mean, without weighting by audience, market share, revenue or user base.
Report 1 is the first wave to be compared against the baseline established in the Baseline Survey. To preserve consistency across waves and avoid misreadings, results are presented in two complementary ways, according to the nature of each breakdown: (i) In absolute value (0–100 scale) — for the overall index and for the demographic breakdowns (social class, age group, gender and region). In these cases, the level of trust is directly interpretable and it makes sense to compare the groups with one another — for example, to state that class A trusts more than class C — because they all measure the same thing (people’s trust) in subsets of the same population; (ii) In relative change, normalized with Baseline = 1.00 — for categories, subcategories, dimensions and platforms. Each of these units starts from its own base point equal to 1.00 (its value in the Baseline Survey), and what is reported is how much it moved, not its absolute level. This choice is deliberate: units of very different natures — a social network and a government service, for example — are not comparable in level, and the index is not meant to say that one type of platform is “worth more” than another. Normalization avoids this improper comparison, keeps the focus on each unit’s trajectory of gain or loss of trust over time, and ensures that future waves are always read against the same base.
Beyond the cross-sectional cut — which compares the full samples of the two waves, made up mostly of different people — Report 1 includes a repeated-panel subsample: 209 respondents (about 20%) who had already taken part in the Baseline Survey and were re-interviewed. Because it follows the same people over time, the panel makes it possible to distinguish a real change of opinion from a mere change in the composition of who was surveyed, and is more precise at capturing small movements. Because it is a subsample that is not representative of the population, the panel measures change, not level, and its variations are also read against the base (paired change).
Finally, the reading of changes took into account the specific margin of error of each breakdown — larger the smaller the subgroup. Changes that exceed this margin are treated as real change; below it, as “signals to watch”.
[MT]Bias-reduction Procedures
[MX]Consolidated theoretical and methodological references: the structure of the index was based on recognized literature on measuring trust in digital environments and on the construction of composite indicators.
Instrument standardization: all platforms were assessed on the basis of statements written in simple language and with a similar structure, with minimal adaptations by category, reducing artificial variations in interpretation.
Exclusion of non-substantive responses: “I don’t know” and “I don’t know this platform” responses were excluded from the calculation of each platform, avoiding distortion of the average by respondents without enough familiarity to give an opinion.
Comparability controls: the index was designed to avoid improper comparisons between distinct categories, to preserve internal normalization by category, and to prevent differences in the nature of the service from contaminating the analysis.
Dual validation at interpretive stages: for the data-analysis stages, a cross-validation process was adopted. At least two researchers reviewed the text and the inferences drawn.
Methodological transparency: analytical decisions were made explicit from the baseline edition onward, including the conversion formula, aggregation criteria, absence of weighting, and caveats about interpretive limits, in line with Reglab’s replicability standard.
Methodological consistency across waves: the same instrument, the same coding scheme and the same index formula were applied to both waves, and normalization used the same base (Baseline = 1.00). This ensures that the observed variations reflect a change in perception, and not changes in method or processing between rounds.
Separating real change from compositional change: because part of the sample is made up of different people in each wave, an aggregate change may reflect only who was surveyed, not a change of opinion. The repeated panel (the same 209 people in both waves) was incorporated precisely to distinguish the two. This is a lens that the comparison between independent samples does not offer.
Significance threshold and caution with subgroups: only variation that exceeds the margin of error of the specific breakdown (larger the smaller the group) was treated as real change; below that, results were classified as “signals to watch”. In blocks with many simultaneous comparisons, a stricter criterion was adopted (correction for multiple comparisons), and small-N breakdowns, including the panel subgroups, were read as indicative, not conclusive.
[MT]Other methodological limitations
[MX]Perception, not behavior: the Index measures what people believe and feel about platforms, not what actually happens with their data or experiences. A platform may have high technical security standards and still receive a low score — or the reverse.
Equal weights across dimensions: the four dimensions contribute equally to the Composite Index. Alternative weightings could produce different results.
Equal weights across platforms: all platforms have the same weight in the calculation of the category subindices, regardless of the size of their user base.
Exclusion due to unfamiliarity: less well-known platforms are assessed by a smaller subset of the sample, which may introduce selection bias.
Timing and context of collection: results reflect the moment when the survey was conducted. Trust in platforms can vary significantly in response to security incidents, regulatory changes or high-profile events. This round went to field in June 2026, a period coinciding with the World Cup, the entry into force of the Digital ECA (Child and Adolescent Statute), and the debate on artificial-intelligence regulation — events that may have influenced perceptions and that make it hard to isolate the causes of any movements.
Two waves are still too few to assert trends: with only two rounds and a short interval (about three months), most variations may still be natural sampling fluctuation. For that reason, the report treats as real change only what exceeds the margin of that breakdown; the rest is classified as a “signal to watch”, to be confirmed in future cycles.
Uncertainty grows in smaller breakdowns: the margin of error is not a single figure; it increases as the subgroup shrinks. Breakdowns such as class A and the North and Central-West regions have small samples, and their variations should be read with caution — often they are noise, not a trend.
Limits of the repeated panel: the panel (209 people) is valuable for measuring change, but it is a small subsample that is not representative of the population — it measures change, not level — with a slight over-representation of class C. It is subject to attrition (not everyone returns between waves), to possible conditioning (those who already answered may answer differently), and to regression to the mean (those who were very high tend to come down, and those who were low, to rise). Its subgroups are therefore indicative, not conclusive.
Change of opinion vs. change of composition: because much of the sample is made up of different people in each wave (about 80% new respondents in Cycle 2), an aggregate change may reflect who was surveyed, and not a change in perception. The repeated panel mitigates this risk, but the reading of the cross-section should always take this caveat into account.
Multiple comparisons: by testing many breakdowns, categories and dimensions simultaneously, the chance of finding “significant” differences by chance increases. A stricter criterion was adopted in these cases, but isolated signals may still be spurious until they recur in future rounds.
[MT]Software used
[MX]Python (pandas, NumPy, SciPy, statsmodels, Plotly and Matplotlib) and Claude Code — processing of the databases, calculation of the composite index, normalization (base = 1.00), statistical tests (comparison across waves, paired panel and factor analysis), and generation of the figures.
MS Office and Google Workspace suites — text, spreadsheet and chart editing.
Gemini 3.1 and ChatGPT 5.3 — brainstorming, systematization of information and writing support.
Adobe Creative Cloud suite — layout and finalization of charts and illustrations.
Ethical guidelines
Processing of personal data: the research involved limited processing of personal data, restricted to the stages of collection, organization and statistical analysis of the sample. The data were processed in aggregate form by Offerwise and anonymized on delivery to Reglab, so that it is not possible to identify, directly or indirectly, the responding person from the published information. There is no exposure of individualized responses, nor any processing aimed at profiling or automated decision-making regarding participants.
Purpose and adequacy: the data were used exclusively for research and index-construction purposes, in accordance with the objectives disclosed to respondents in the context of the panel.
Minimization and aggregation: the disclosed results are aggregated by category, subcategory, dimension and sociodemographic breakdowns. There is no public exposure of individual scores per respondent nor of identifiable personal data.
Secrecy and confidentiality: individualized information about participants is not disclosed. The study operates with consolidated presentation and structured comparisons between groups.
Methodological transparency: the index methodology was described explicitly to allow verification, replicability and proper interpretation of the results. This commitment is consistent with Reglab’s methodological standard for public publications.
Responsible use of data: the research measures social perceptions about digital platforms and is not intended to reinforce discrimination against groups, brands or users. The interpretation of results should be exercised with caution, especially in broad inferences and comparisons between subgroups.
www.reglab.com.br